Investment Themes

Search all article by their themes/tags in the search area
below for example “Energy” or “Technology”.

Search Results

Found 18 results for Fundamental Valuation Tables
March 24 2020

Commentary by Eoin Treacy

Email of the day on global valuation tables

Historically you have shown the PE ratios for a number of the major indices. Considering the levels, the markets are at now, it would be interesting to look at these again. Is this something you can share with the collective.

Eoin Treacy's view -

Thank you for this email which may be of interest to subscribers. I produced the Fundamental Valuation Tables on a monthly basis for approximately 8 years but they always had to carry a number of riders at the bottom of the page highlighting caveats that needed to be taken into account before looking at the data. These included the absence of data for some indices, the distorting effect of ADRs and the fact P/E ratios are based on indicated earnings rather than any other calculation and as a result were prone to spikes. As a result, I stopped producing the reports when I found a better online resource.

Germany based Star Capital produce comprehensive valuation tables for just about every country which also include cyclically adjusted P/Es. This is all presented in an attractive graphic format.

Shiller’s Multpl.com is an additional resource for long-term charts of P/Es for the USA as well as bond yields that may be of interest.


This section continues in the Subscriber's Area. Back to top
May 10 2018

Commentary by Eoin Treacy

Email of the day on World Equity Valuation tables:

Trust that you have been keeping well. You used to post a monthly update on World Equity Market Valuations Tables. Would you be able to provide this or if you could advise where such data may be available will be great? Thanks for the excellent service as always.

Eoin Treacy's view -

Thank you for this email which may be of interest to subscribers. I produced the Fundamental Valuation Tables on a monthly basis for approximately 8 years but they always had to carry a number of riders at the bottom of the page highlighting caveats that needed to be taken into account before looking at the data. These included the absence of data for some indices, the distorting effect of ADRs and the fact P/E ratios are based on indicated earnings rather than any other calculation and as a result were prone to spikes. As a result, I stopped producing the reports when I found a better online resource. 


This section continues in the Subscriber's Area. Back to top
January 13 2016

Commentary by Eoin Treacy

Email of the day on Fundamental Valuation Tables

Happy New Year, I hope it brings you and your family health and happiness. Request: Can you please post on your site the table of global indices P/B, P/E and Dov. rankings etc? It is something I value a lot

Eoin Treacy's view -

Thank you for this email which may be of interest to subscribers. I produced the Fundamental Valuation Tables on a monthly basis for approximately 8 years but they always had to carry a number of riders at the bottom of the page highlighting caveats that needed to be taken into account before looking at the data. These included the absence of data for some indices, the distorting effect of ADRs and the fact P/E ratios are based on indicated earnings rather than any other calculation and as a result were prone to spikes. As a result I stopped producing the reports when I found a better online resource. 


This section continues in the Subscriber's Area. Back to top
August 05 2015

Commentary by Eoin Treacy

Email of the day on historical cyclically adjusted valuation metrics

Just wondering, would you know of reputable data providers for graphs of cyclically-adjusted PER, cyclically-adjusted P/BVPS, cyclically-adjusted DY for equity indices and individual equities? Preferably if the service is free/cheap and dependable ; but ok if paid too. I know of www.multpl.com (free) for the PER of S&P500. Regards.

Eoin Treacy's view -

Thank you for this question. Bloomberg does not carry cyclically adjusted valuation measures so we do not have access to them. A number of third party sources calculate these measures independently and each has its own idiosyncrasies in how they compute the level. Multipl.com is a great resource for the USA both for CAPE and historic Treasury yields. 


This section continues in the Subscriber's Area. Back to top
July 06 2015

Commentary by Eoin Treacy

World Equity Market Valuations Tables July 6th 2015

Eoin Treacy's view -

A link to the full report is posted in the Subscriber's Area.

Following the correction on Chinese stock markets over the last month, valuations have improved considerably with the Hang Seng, China Enterprises Index and Mainland 25 all now trading back on single digit multiples. 

The Hang Seng in particular pulled back sharply today, in a potentially climactic decline, to test the region of the 200-day MA, the upper side of the underlying trading range and the psychological 25,000 level. A clear upward dynamic would confirm near-term support in this area. 

Please note: All data quoted above originates in Bloomberg. We realise that some of the data displayed is inaccurate for some indices, particularly where ADRs are included. However, I have endeavoured to remove the most problematic indices. We publish these tables because the data is generally accurate and going forward we will continue to weed-out the less reliable data sets as subscribers highlight them for us. The P/Es quoted by Bloomberg are exclusively based on operating earnings.)


This section continues in the Subscriber's Area. Back to top
June 08 2015

Commentary by Eoin Treacy

May 11 2015

Commentary by Eoin Treacy

March 09 2015

Commentary by Eoin Treacy

World Equity Market Valuations Tables March 9th 2015

Eoin Treacy's view -

A link to the full report is posted in the Subscriber's Area. 
 
Please note: All data quoted above originates in Bloomberg. We realise that some of the data displayed is inaccurate for some indices, particularly where ADRs are included. However, I have endeavoured to remove the most problematic indices. We publish these tables because the data is generally accurate and going forward we will continue to weed-out the less reliable data sets as subscribers highlight them for us. The P/Es quoted by Bloomberg are exclusively based on operating earnings.) 


This section continues in the Subscriber's Area. Back to top
February 06 2015

Commentary by Eoin Treacy

World Equity Market Valuations Tables January 6th 2015

Eoin Treacy's view -

A link to the full list is posted in the Subscriber's Area. 

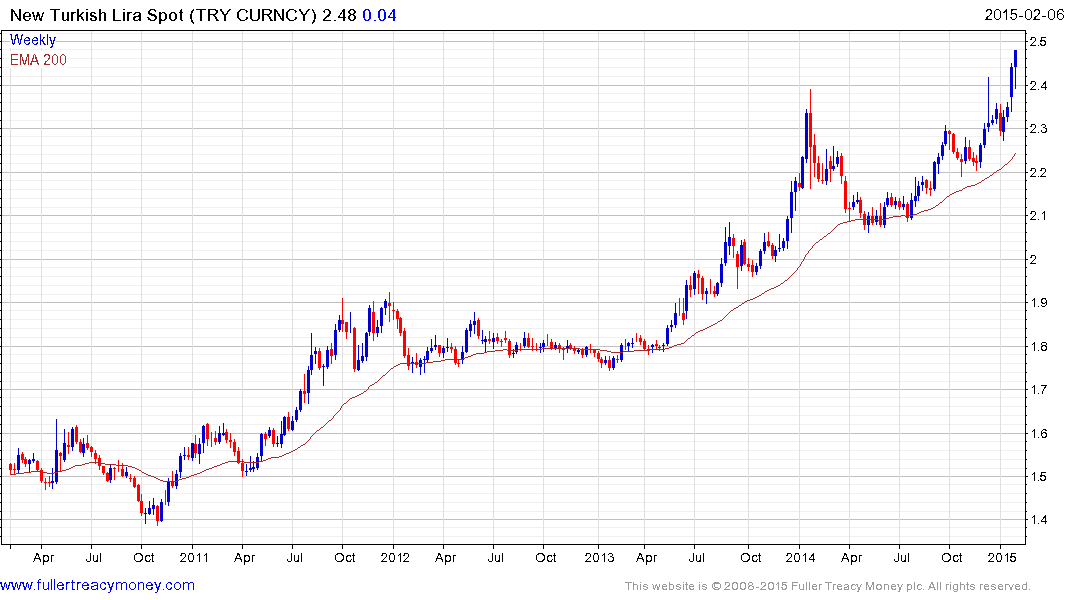
This month the Turkish market is worth highlighting. The country has experienced some quite considerable currency weakness and hit a new low against the US Dollar today. It has been steadier against the Euro but that is more a factor of Euro weakness than any particular strength for the Lira. Turkey’s proximity to Iraq and Syria, both geopolitical flashpoints, may also be contributing to the pressure the currency is under.


This section continues in the Subscriber's Area. Back to top
January 08 2015

Commentary by Eoin Treacy

World Equity Market Valuations Tables January 8th 2015

December 10 2014

Commentary by Eoin Treacy

World Equity Market Valuations Tables December 10th 2014

Eoin Treacy's view -

A link to the full list is posted in the Subscriber's Area.

Please note: All data quoted above originates in Bloomberg. We realise that some of the data displayed is inaccurate for some indices, particularly where ADRs are included. However, I have endeavoured to remove the most problematic indices. We publish these tables because the data is generally accurate and going forward we will continue to weed-out the less reliable data sets as subscribers highlight them for us. The P/Es quoted by Bloomberg are exclusively based on operating earnings.)


This section continues in the Subscriber's Area. Back to top
November 06 2014

Commentary by Eoin Treacy

World Equity Market Valuations Tables November 6th 2014

Eoin Treacy's view -

A link to the full list is posted in the Subscriber's Area.

Russia (P/E 5.66) and the Hong Kong Enterprises (H-Shares) Index (P/E 7.3) have similar valuations but couldn’t be more different. Russia represents the degradation of an economy due to adventurism by the ruling oligarchy. The H-Shares represent a market which has been constrained by tight monetary policy for three years and is only now emerging from it. 


This section continues in the Subscriber's Area. Back to top
October 07 2014

Commentary by Eoin Treacy

September 09 2014

Commentary by Eoin Treacy

World Equity Market Valuations Tables September 9th 2014

Eoin Treacy's view -

A link to this month's table is posted in the Subscriber's Area.

Heightened geopolitical risk is a thread linking the top three markets in terms of dividend yields this month. Lithuania and Estonia both have land borders with Russia but are also members of the EU and have the Euro as their currency. While Russia might be able to fob off the global community with arguments that the formation of Ukraine was a false proposition and that it has the right to take back its territory, EU members would feel obliged to intervene if the same arguments were used in the Baltics. However this does not obscure the fact the economies of Estonia and Lithuania remain dependent on trade with Russia which is currently under threat due to sanctions. 


This section continues in the Subscriber's Area. Back to top
August 08 2014

Commentary by Eoin Treacy

World Equity Market Valuations Tables August 8th 2014

Eoin Treacy's view -

A link to the full report is posted in the Subscriber's Area.

Russia is unsurprisingly the world’s cheapest market on a P/E basis with a value of 5.25 and yield of 5%. Geopolitical uncertainty will deter the majority of investors since we just don’t know when the situation in Ukraine will eventually be resolved. 

(Please note: All data quoted above originates in Bloomberg. We realise that some of the data displayed is inaccurate for some indices, particularly where ADRs are included. However, I have endeavoured to remove the most problematic indices. We publish these tables because the data is generally accurate and going forward we will continue to weed-out the less reliable data sets as subscribers highlight them for us. The P/Es quoted by Bloomberg are exclusively based on operating earnings.)


This section continues in the Subscriber's Area. Back to top
July 08 2014

Commentary by Eoin Treacy

June 02 2014

Commentary by Eoin Treacy

World Equity Market Valuations Tables June 2nd 2014

Eoin Treacy's view -

There has not been a great deal of movement in the ordering of the constituents of these tables since I last posted them in March. China remains the cheapest major market, Russia’s valuations are the lowest, not least because of political uncertainty and Japan’s 2nd Section is also close to the top of the list. 


This section continues in the Subscriber's Area. Back to top
March 24 2014

Commentary by Eoin Treacy

World Equity Market Valuations Tables

I posted the last edition of this table in September before our transition to the new site infrastructure and am happy to reintroduce it now

Eoin Treacy's view -

On this occasion valuations for 99 globally significant indices from January 6th are depicted in the left hand set of columns and today’s values can be found in the right-hand set of columns.

While there has been a great deal of volatility on global markets over the same timeframe, valuations have been relatively static. However when we take currency market volatility into account, a truer picture of performance is revealed. Argentina and Russia may have low valuations but their currencies have also been the worst performing this year.


This section continues in the Subscriber's Area. Back to top