
World Equity Market Valuations Tables June 2nd 2014

There has not been a great deal of movement in the ordering of the constituents of these tables since I last posted them in March. China remains the cheapest major market, Russia’s valuations are the lowest, not least because of political uncertainty and Japan’s 2nd Section is also close to the top of the list.
Here is a link to the associated PDF.
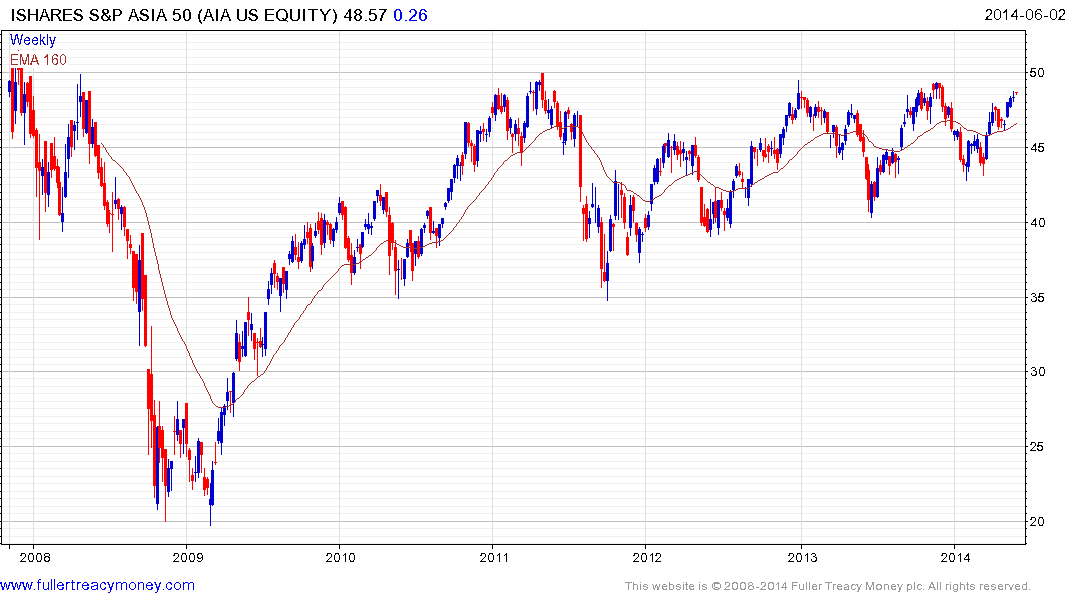
The S&P ASIA 50 INDEX CME (P/E 10, DY 2.96, P/B 1.4, P/CF 5.62) caught my attention not so much because it is now in the top-10 indices with the lowest historic P/Es but because of its constituents. The Index is made up of major blue chips from Hong Kong, Taiwan, South Korea and Singapore. It has held a progression of higher reaction lows since late 2011 and while some consolidation in the region of the 3-year peaks is a possibility, a sustained move below the January low would be required to question medium-term scope for a successful breakout. The US Dollar denominated iShares Asia 50 ETF tracks this index.
(Please note: All data quoted above originates in Bloomberg. We realise that some of the data displayed is inaccurate for some indices, particularly where ADRs are included. However, I have endeavoured to remove the most problematic indices. We publish these tables because the data is generally accurate and going forward we will continue to weed-out the less reliable data sets as subscribers highlight them for us. The P/Es quoted by Bloomberg are exclusively based on operating earnings.)
Back to top