
Comments posted on central bank balance sheet charts
Terrific chart. Can you put it in the library please?
The BoJ appear to be keeping things afloat and rumours abound that they will have to go all in soon or the great experiment in Abemonics will get derailed. The economic stats recently have been less than encouraging...
And
I read that China is printing more money than the US - they have created Renminbi equivalent to 50 bn $ per month over the last six months. What is the graph like if this is added!

Thank you both for these additional comments on yesterday’s composite chart of major central bank balance sheet sizes.
The Bank of Japan has little choice but to proceed with QE, in its efforts to reignite growth and inflation, now that it has embarked on the extraordinary monetary policy route. While QE has had mixed results in achieving economic growth it has been much more successful in inflating asset prices. Loose monetary policy is important for Japan, but Abenomics is likely to succeed or fail based on their success in imposing regulatory and process reform and in controlling energy price inflation.
I have now also added the PBOC Balance Sheet Chart to the Chart Library and updated the total assets chart for the Fed, ECB, BOJ and PBOC. Unfortunately, it is not possible to add this chart to the Chart Library.
We are dealing with some very large numbers, reported in different denominations and in different currencies, so I created an Excel sheet to check my work and illustrate the relative importance of various central banks. By my calculation the PBOC has the largest balance sheet with $5.3 trillion, the Fed’s balance sheet is $4.3 trillion, the ECB’s is $2.8 trillion and the BOJ’s is $2.5 trillion.
When we add the PBOC to the composite chart is smoothes out the data considerably due to its size. I was slow to add the Chinese figures because the currency is not fully convertible but considering how active China has been in investing globally it makes sense to include it.
The actions of the ECB go a long way towards explaining the relative stability of the Euro over the last couple of years despite the economic turmoil the group has experienced. However, the broader picture is of central banks engaged in competitive devaluation in order to avoid their currencies appreciating versus their competitors. Little wonder then that some investors are interested in a store of value that cannot be created by central bank financial engineering.
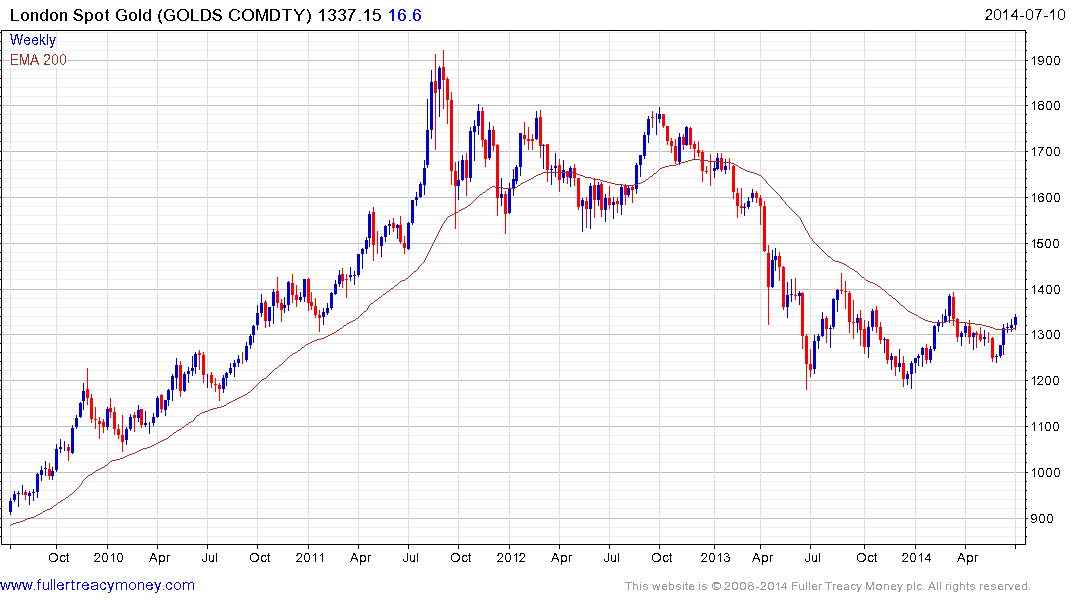
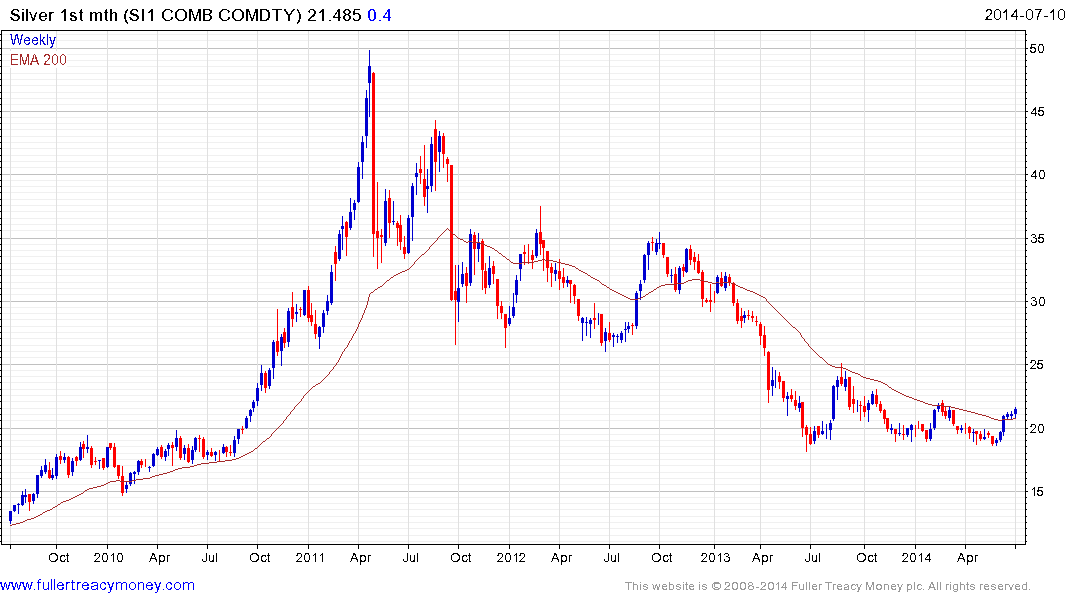
Gold continues to rally towards the upper side of its yearlong base, having found support in the region of the 200-day MA from early June. Considering the technical damage experienced in early 2013, the most likely scenario is for higher to lateral ranging as confidence is rebuilt. Silver in particular is rallying from a low base.
Equities generally perform well in an environment where the value of money is deteriorating. Stock markets are highly sensitive to liquidity, not least because we are five years into a cyclical bull market that has been fuelled by central bank largesse.