Are Buybacks an Oasis or a Mirage?
This insightful piece by Chris Brightman, Vitali Kalesnik, Mark Clements for Research Affiliates may be of interest to subscribers. Here is a section:
1. In 2014, the S&P 500 Index’s dividend (1.9%) + buyback (2.9%) yield = 4.8%, but this yield was not realized by investors.
2. As in most years, in 2014 issuance of new shares—for management compensation, new investments, and funding mergers and acquisitions—exceeded buybacks.
3. The dilution rate for the U.S. equity market in 2014 was 1.8% compared to the historical dilution rate of 1.7% over the 80-year period from 1935 to 2014.
4. U.S. equity investors in aggregate—contrary to appearances—have not realized a benefit from the recent spate of stock repurchases.
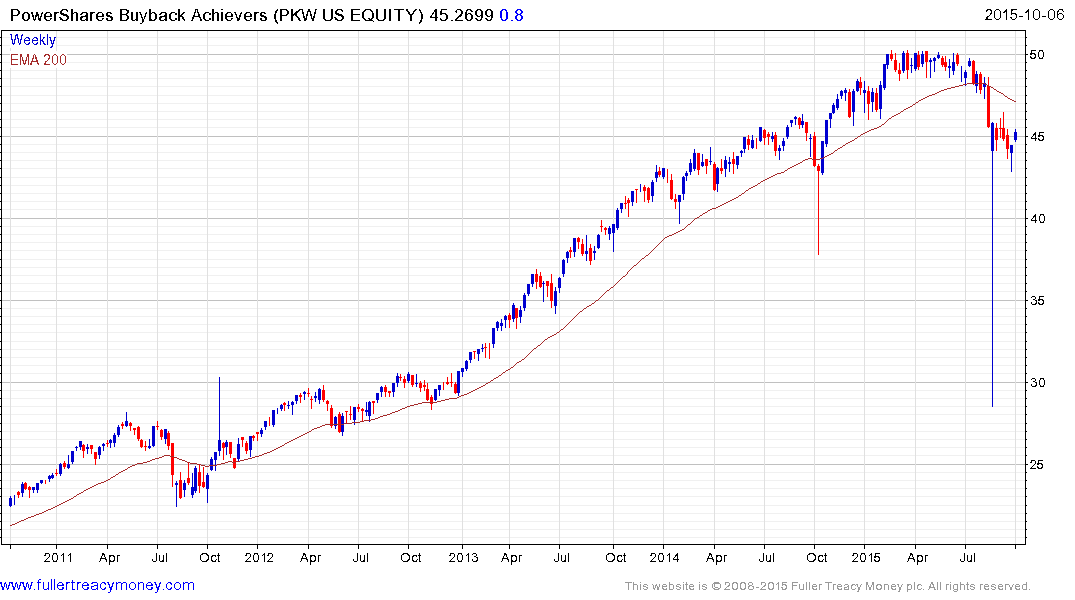
The PowerShares Buyback Achievers ETF outperformed by a considerable margin between 2009 and 2013. In order to be included a company has to buyback 5% of its free float on a trailing 12-month basis. With such support from management, it is little wonder investors wish to piggy back on company purchases with the result that buybacks are now a major consideration in the decisions of investors whether to participate in the market.

At the Contrary Opinion Forum last week I had an interesting conversation with Louis Navellier who made the point that executives learn during their MBA that with interest rates low you buy back shares and issue debt and with higher interest rates the pendulum swings towards issuing shares because debt is more expensive. That makes sense to me but the simplicity of the decision making process contributes to groupthink in the broad room. Buybacks represented a major source of demand for the market and the potential for boards to come to the same conclusion at the same time with regard to the benefit of buybacks is a potentially important consideration when interest rates eventually rise.

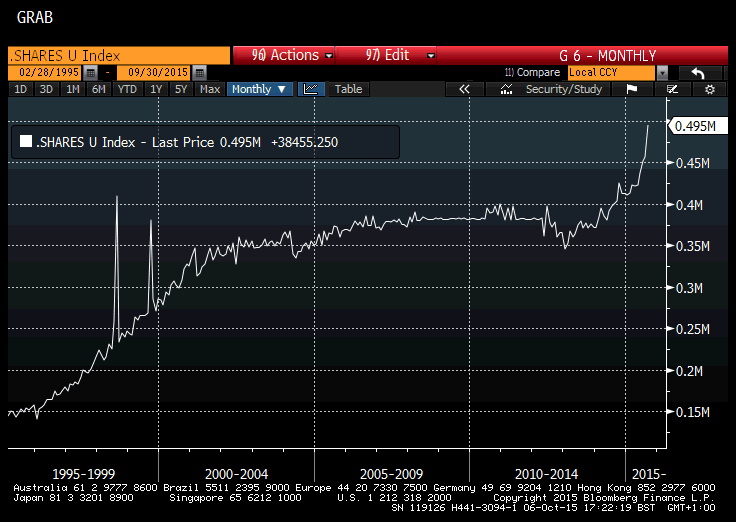
After reading the above article I revisited this chart I created a few years ago. I have to admit I hadn’t looked at it in a while but was surprised by the developments over the last year. It depicts the number of shares outstanding on the NYSE by reverse engineering the trend from the percentage of short interest relative to the total number of shares. It had contracted following the credit crisis since companies were reluctant or unable to borrow but has surged over the last year as issuance has outweighed buybacks. This supports the view taken in the above article and represents a headwind for the wider market in the absence of a corresponding surge in demand.
Back to top


