
Musings From the Oil Patch October 6th 2015
Thanks to a subscriber for this edition of Allen Brooks’ ever interesting report for PPHB. Here is a section:
The new Imperial Oil technology involves adding a solvent to improve the flow of oil to the surface as well as generators that burn less natural gas to supply the steam. What we understand about Imperial Oil’s new technology is that currently proposed oil sands projects could produce 55,000 to 75,000 barrels a day in oil output compared to their presently planned output of 30,000-40,000 barrels a day according to Mr. Krüger. As he was quoted during the presentation,
“This is bigger on a per phase basis than we’ve talked about in the past.” From Mr. Krüger’s viewpoint, this technology represents “a very large, long-term growth opportunity.” Even though the company seems satisfied with the new technology, it is not ready to move forward with some of these planned oil sands projects while management assesses their cost, possible changes to Alberta’s regulatory policies and the outlook for global oil prices.
Citi Research has prepared a chart showing its assessment of the impact of technological and economic cost reductions of various oil outputs between 2014 and 2015, based on assumed 2020 output contribution, due to the industry downturn. Most of the decline since 2014 is about $5 per barrel, although Gulf of Mexico costs may have declined by $7 a barrel and the shale formations by $10 a barrel. If Mr. Krüger’s assessment of the impact on output from Imperial Oil’s new technology is correct, then there would likely be a significant reduction in the cost of new oil sands output. According to the Citi Research chart, they estimate that oil sands currently cost between $80 and $100 a barrel. However, if the Imperial Oil claims are correct and can be implemented commercially, then a 30% output improvement might translate into $25-$30 per barrel cost reductions.
Obviously there are a number of assumptions that must be made in reaching this conclusion, including that the solvent-added SAGD process is not more costly than what is being done now and that additional output volumes require extensively larger facilities in order to handle them.
If you are Saudi Arabia and you have targeted new, large and long-term output sources such as oil sands and deep water oil in your price war, the prospect of their costs declining materially has to be unnerving. It has been our contention that Saudi Arabia’s target was these deposits, including Arctic output, and less about the domestic shale business. Why? The shale revolution is a “real-time” output, meaning that if producers are forced by economics to stop drilling, eventually oil prices will rise, drilling will resume, as will shale output, and the price cycle will start all over again.

Here is a link to the full report.
Technological innovation continues apace and lower energy prices only increase the incentive to develop solutions in order to ensure survival. North America represents an exciting energy geography and the relatively low price of oil does not change that. On the other hand the continued development of new extraction methods may keep a lid on prices but will increase volumes.
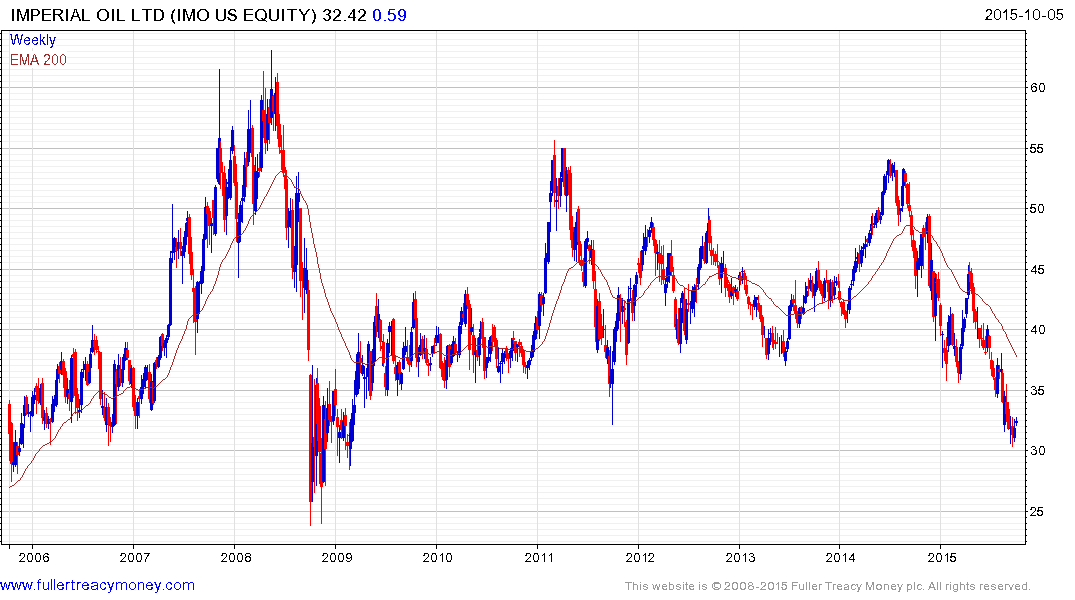
Imperial Oil has experienced a similar decline to most oil companies but has found at least near-term support and potential for a reversionary rally is looking increasingly likely.
Elsewhere pipelines depend on volumes rather than prices and the MLP sector has experienced an even sharper sell-off as leveraged participants exited en masse. Here are some examples:
Rose Rock Midstream LP (Est P/E 19.29, DY 8.22%) more than halved before posting a large upside weekly key and following through to the upside this week.
Plains All American Pipeline LP (Est P/E 20.05, DY 8.26%) posted an upside weekly key from the region of the 2011 lows last week.
Magellan Midstream LP (Est P/E 21.06, DY 4.32%) experienced one of the shallower declines and also posted a large upside weekly key reversal last week.
ONEOK Partners LP (Est P/E 20.32, DY 9.3%) experienced one of the deeper declines and found support last week above its late August low.
Back to top