
Overextensions relative to the trend mean

We do not regard the 200-day MA moving average as a sacrosanct level where support or resistance need to be found in order to confirm the consistency of a trend. Rather we look on it as the trend mean around which prices move. In an upward trending environment we can expect the price to find support in the region of the trend mean as long as a demand dominated environment persists. Since the crowd plays such an important role in the day to day gyrations of any market prices can and do overshoot.
At this time of the year I am inclined to look at overextensions relative to the trend because when prices diverge from it by a large margin it tells us a lot of trading activity has already taken place and many investors are already positioned for the surge to continue. Of course for a wide overextension relative to the MA to continue to expand even more investors need to believe the move will continue.
I created this spreadsheet of the S&P500’s constituents and ranked them by the largest overextensions relative to the trend mean.
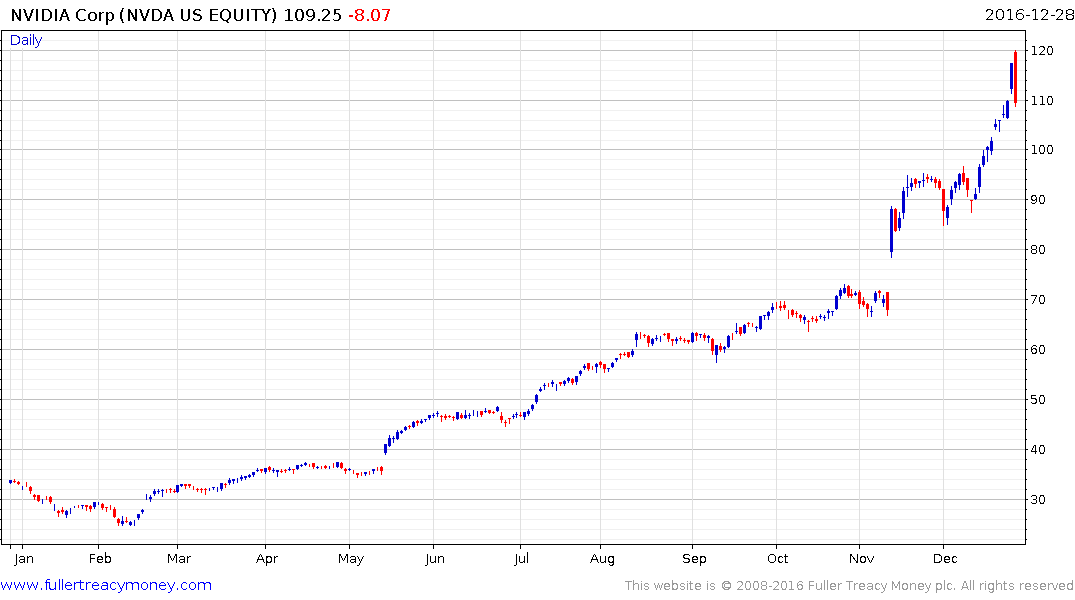
Right now NVidia is 92% overextended relative to the trend mean. In other words it could fall almost 50% and still be trading above it. Following such a clear acceleration the risk of a correction is looming large. Today’s downside key day reversal suggests $120 represents a peak of at least near-term and probably medium-term significance.
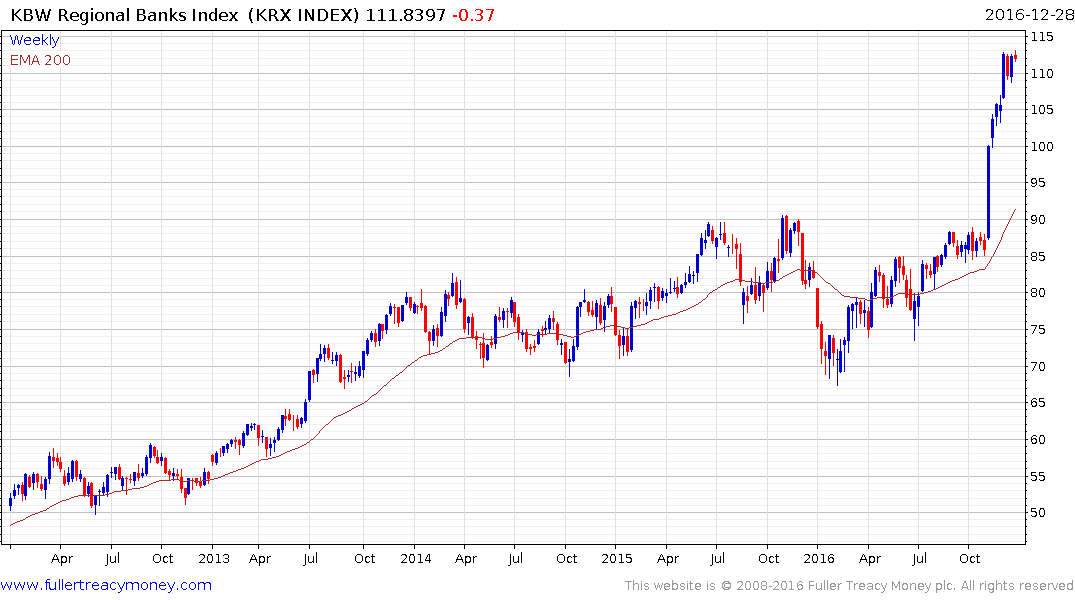
The banking sector now dominates the ranks of the S&P500’s best performers following a storming rally since early November. A clear short-term overbought condition is evident so some consolidation is looking increasingly likely. Considering how long the sector underperformed, potential for continued upside can be given the benefit of the doubt provided the region of the trend mean holds following any pullback.
![]()
Transocean has surged higher over the last few months to break a medium-term progression of lower rally highs. Recovery potential can be given the benefit of the doubt provided it finds support in the region of the trend mean following any pullback.
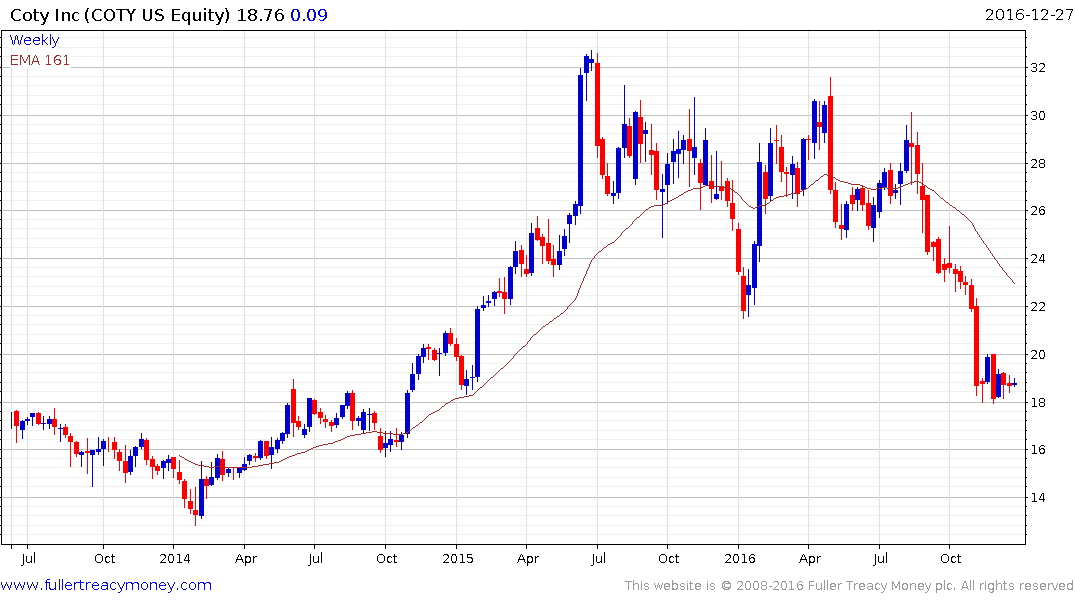
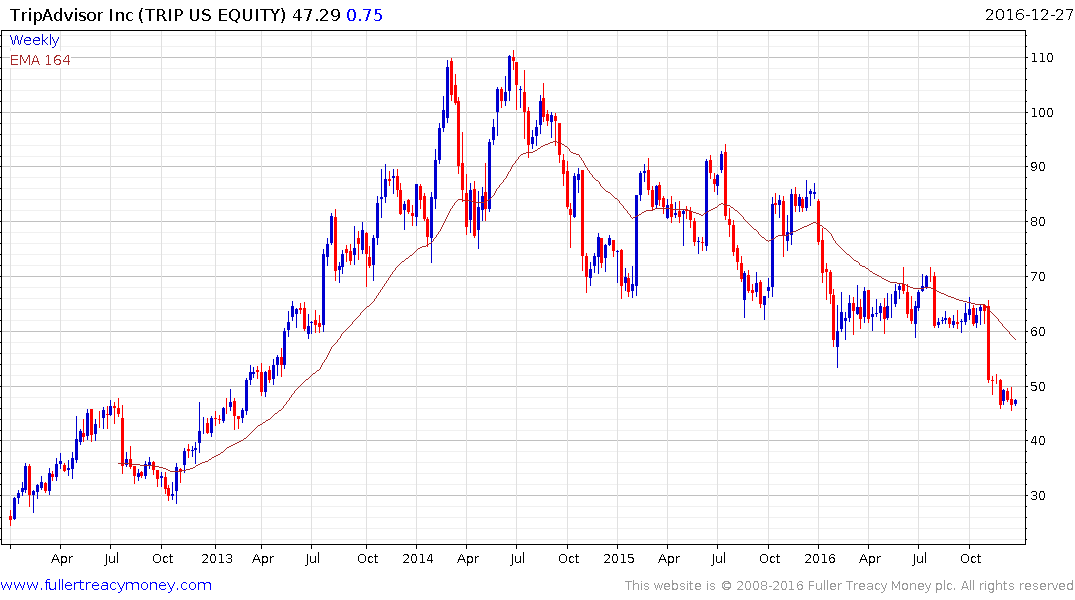
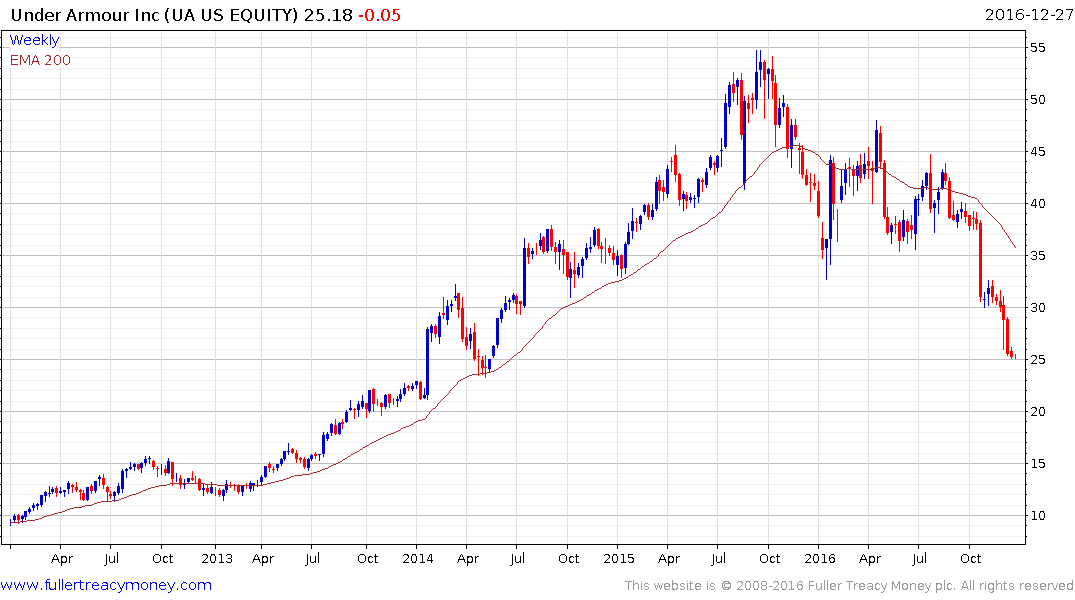
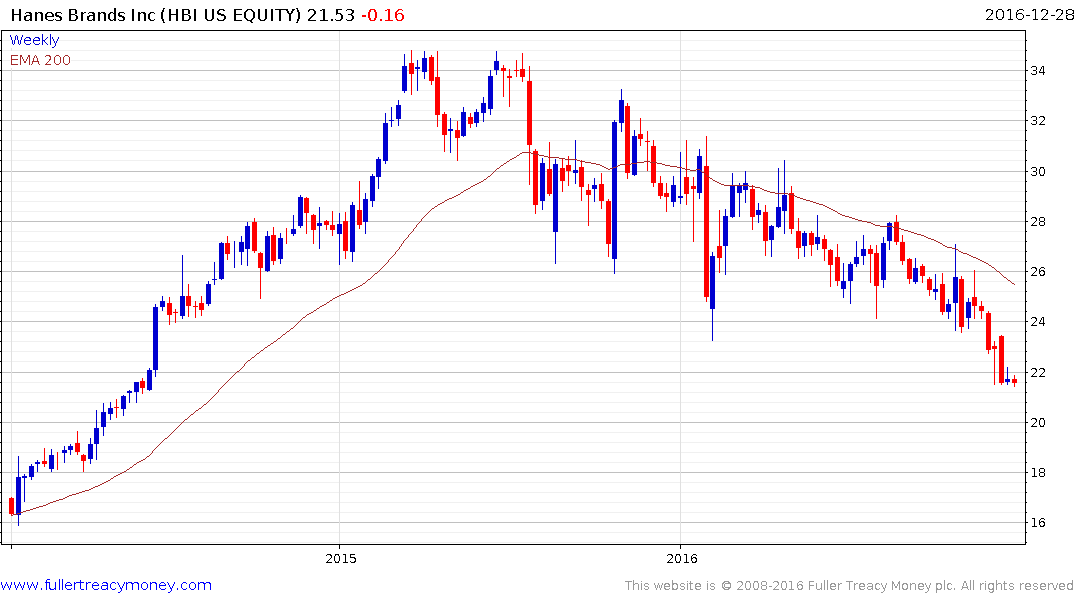
At the other end of the spectrum shares like Coty (25.5%), TripAdvisor 24.06%, Under Armour 23.4%) and Hanesbrands (17.53%) might be somewhat overextended but remain in otherwise consistent medium-term downtrends.
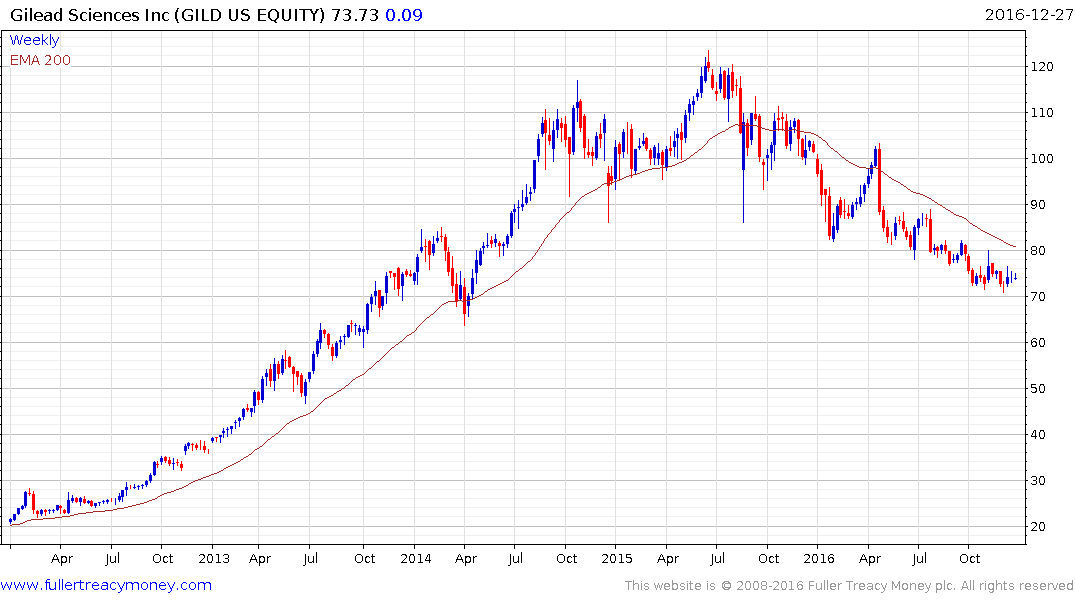
Biotechnology shares dominate the ranks of the underperformers. Many remain in consistent medium-term downtrends with Gilead Sciences being representative.
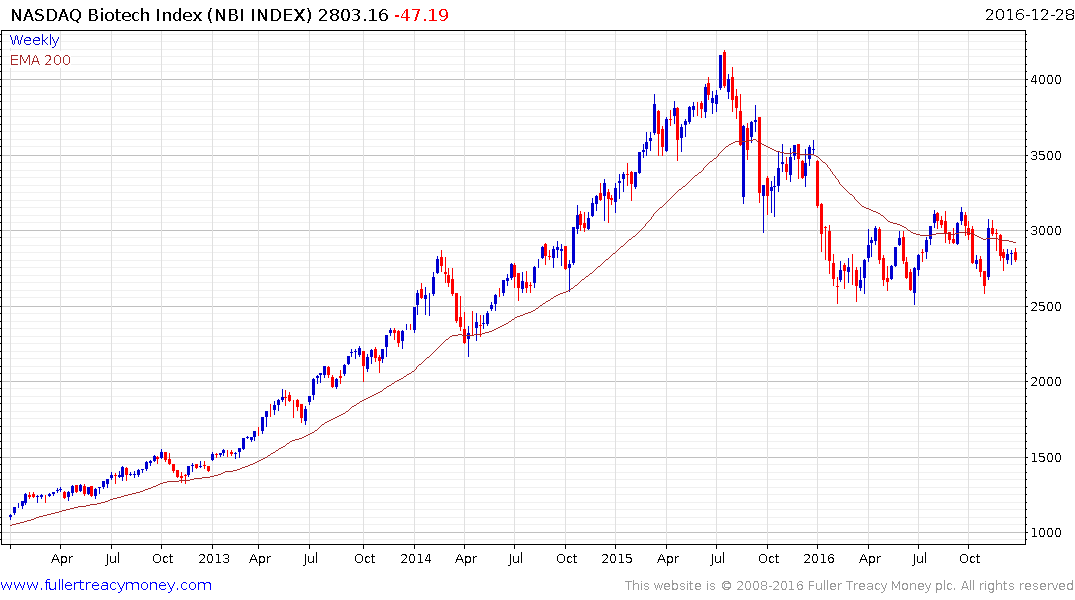
However most of the Nasdaq Biotechnology Index’s decline occurred at the beginning of the year. A sustained move above 300 will be required to signal a return to demand dominance.
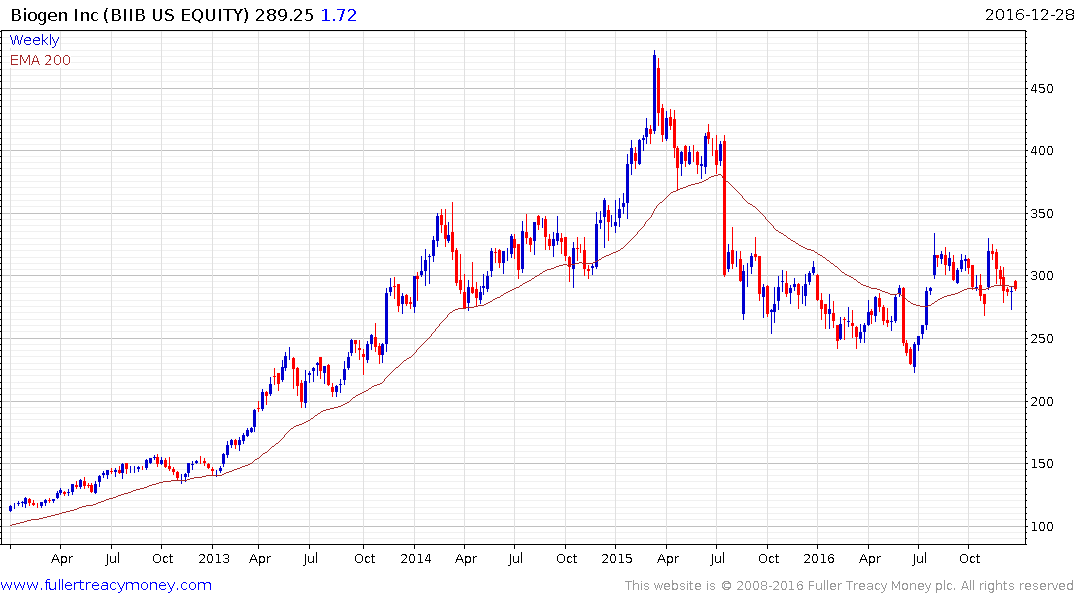
Biogen led on the downside and has been trading mostly above the 200-day MA since July. It needs to hold last week’s low if potential for higher to lateral ranging is to be given the benefit of the doubt.
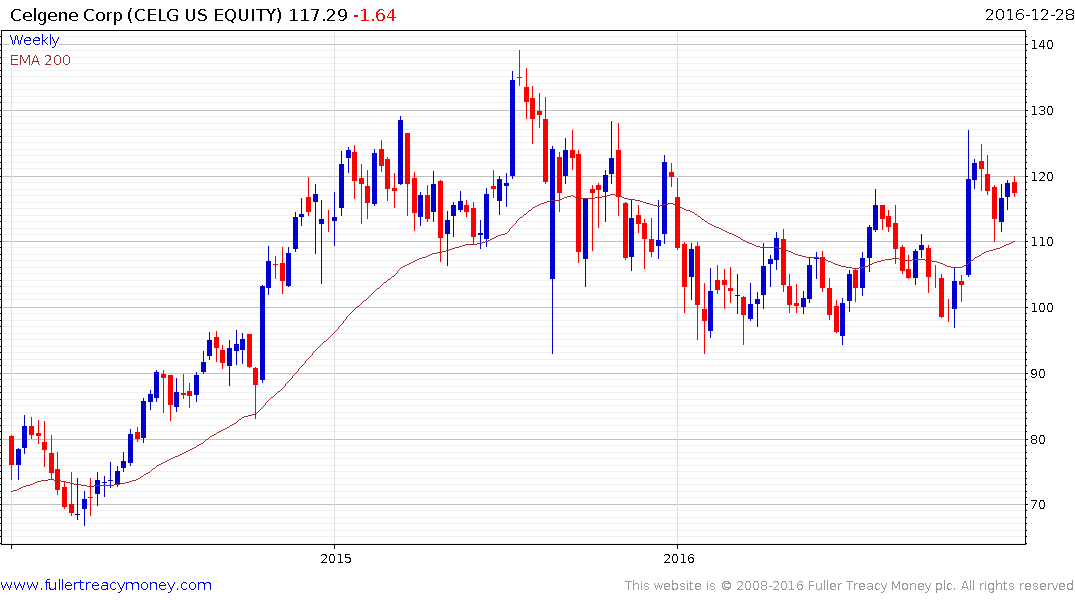
Celgene is also now trading back above its trend mean.