
Kolanovic Says $150 Billion Systematic Selling Drove Stock Rout
This article by Lu Wang for Bloomberg may be of interest to subscribers. Here it is in full:
About $150b worth of stock selling from computer-driven traders and options hedgers drove the S&P 500’s worst two-day slump since 2015, according to JPMorgan strategist Marko Kolanovic.
* The unloading is largely over, Kolanovic wrote in a note to clients on Wednesday
* While the spread of the coronavirus sparked risk-off, traders who watch market trends and volatility for trading signals acted as “significant drivers” of the rout as the S&P 500 broke key support levels
* Exacerbating the sell-off was the dwindling liquidity as a measure known as market depth dropped by more than 50% * The selling trend from commodity trading advisers, or CTAs, now seen over, as S&P 500’s 200d (~3045), 6m (2900) and 12m (2800) signals are not likely being breached
** CTA’s equity exposure fell from ~85th percentile last week to ~40th percentile now
** “Selling will likely stop here”
** “A move higher could prompt CTAs to buy back equity exposure, so we think risk from CTAs is skewed to the upside.”
* Volatility targeters, such as variable annuities and risk parity funds, are likely to continue selling over the next few days to account for the pickup in equity price swings that were too large to be offset by bond moves
** Selling pressure expected to ease once their exposure drops to 35th percentile, vs 75th percentile before the sell-off
* Expected inflows from pension funds, which rebalance monthly and will need to buy stocks to return to prior asset allocation levels following the latest decline, are helping support the market
** That demand estimated to equal to 1-2% upside for the market
* “Option hedgers and CTAs are now more likely to buy than sell, and volatility targeters are still selling but at a lower pace, so we think a short term bounce-back is getting likely given month-end flows”

This note referenced above was released on Wednesday and since then the market has continued lower. However, the sharper the acceleration the closer we are to a low, even if dip buying has not worked to date, it will inevitably work eventually. Today was the last day of the month and it therefore represents the last opportunity for institutional investors like pensions and insurance companies to commit capital to the market.
End of the March returns would obviously be flattered by successfully buying an oversold condition in the early part of the month since a short-term bounce is likely. That does not guarantee a successful pick of the bottom but it is the kind of metric quantitative strategies are designed to take advantage of.
The characteristics of the market has changed over the last decade because of the advent of both quantitative trading and the growth of passive investing. The net effect is to exaggerate the speed and severity of declines. The flash crash in 2010 was a foretaste of the condition we are now living through.

This graphic from Deutsche Bank highlights the fact, the two quickest 10% reactions from an all-time peak have occurred in the last two years. This is not an anomaly but is a symptom of the market condition that has evolved over the last decade.
These kinds of declines are extraordinarily fast and damaging to investor sentiment. They additionally incite contagion selling where investor sell not what they wish but what they must to cover exposure to weakness in other parts of the portfolio.
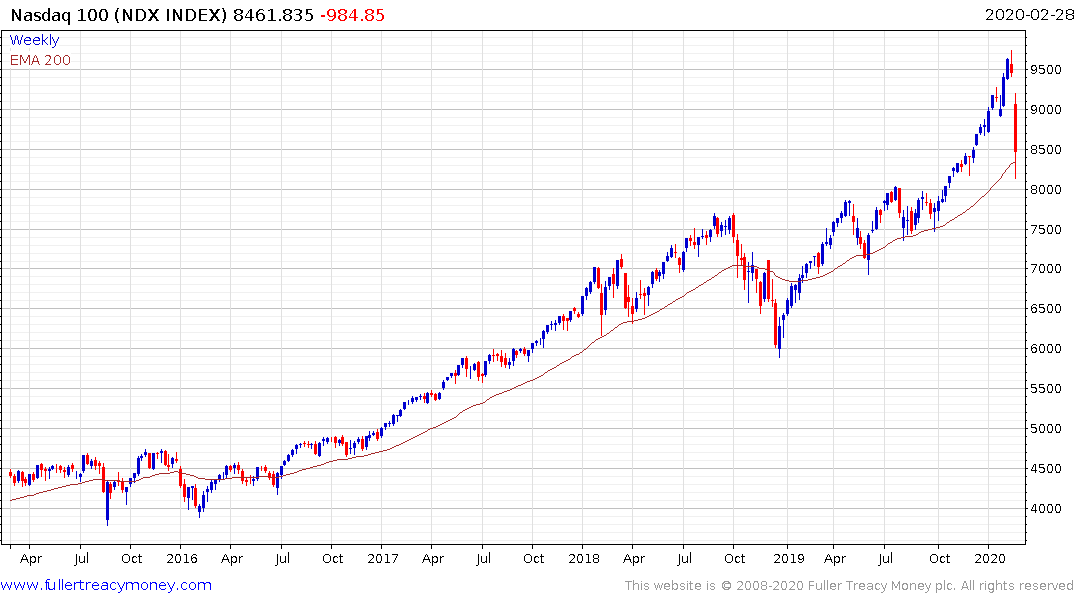
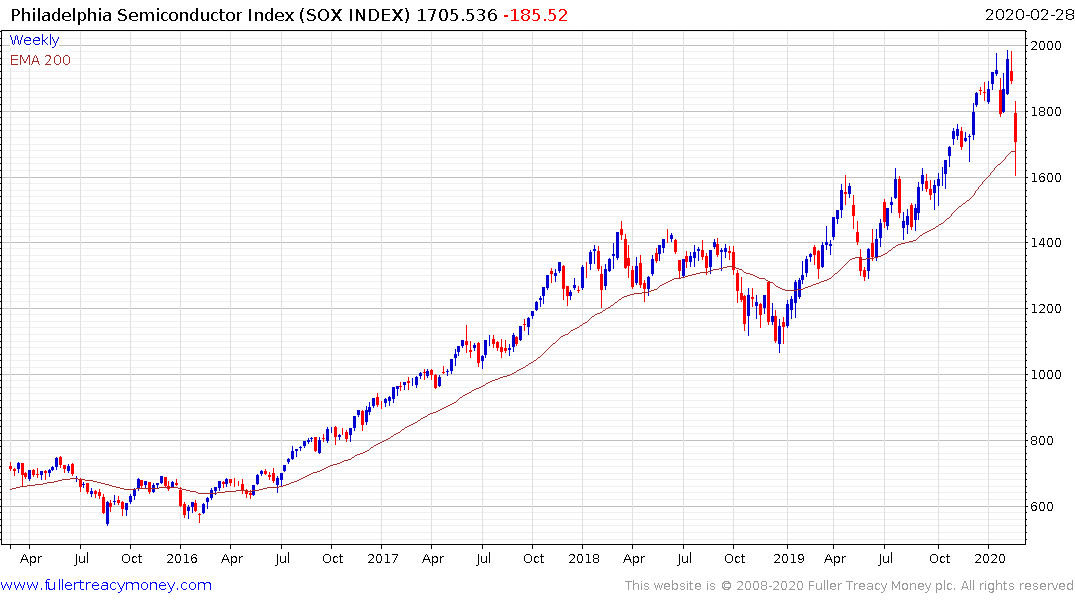
The Nasdaq-100 and the Philadelphia Semiconductors Indices have been the totems of the decade-long bull market. Both are now back trading in the region of their respective 200-day MAs. This is a potential area of support amid the short-term oversold condition.