
Lead Indicators of Recession

After a week characterised by selling across the board, a great deal of profit taking has taken place and many overextensions relative to the trend mean have been unwound. The question I believe many people will be concerned with is whether the coronavirus is going to be the catalyst for an economic contraction? I thought it would therefore be worth monitoring the kinds of instruments that offer a lead indicator for that kind of concern.
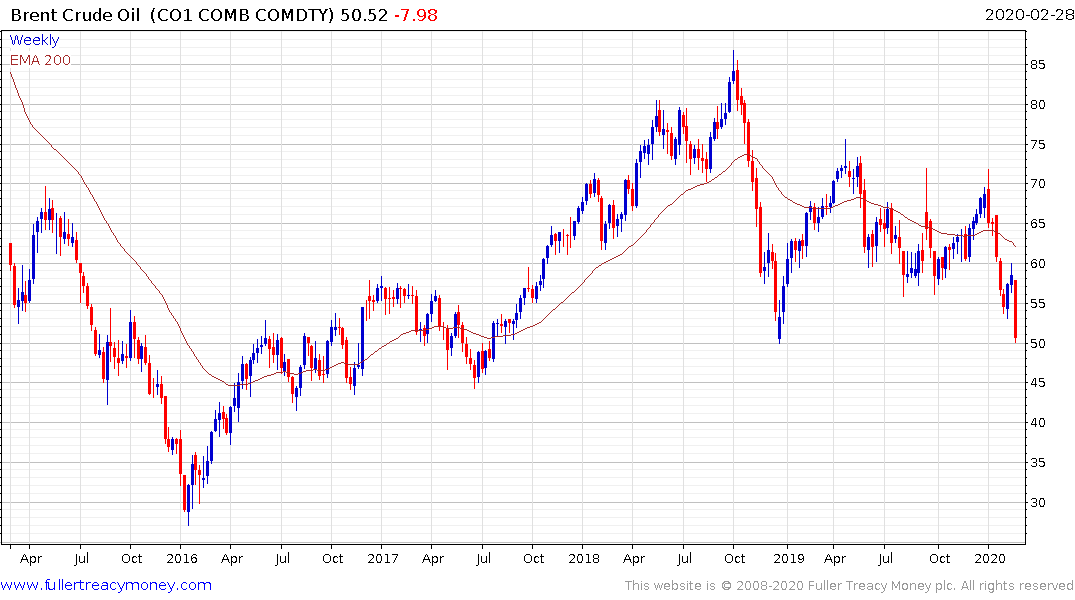
Oil prices are accelerating lower. Since energy is a tax on consumption the fact that energy prices are already weak is removing an expensive from the majority of consumers globally. Therefore, the oil price is not a causal factor in any current fears of economic contraction.
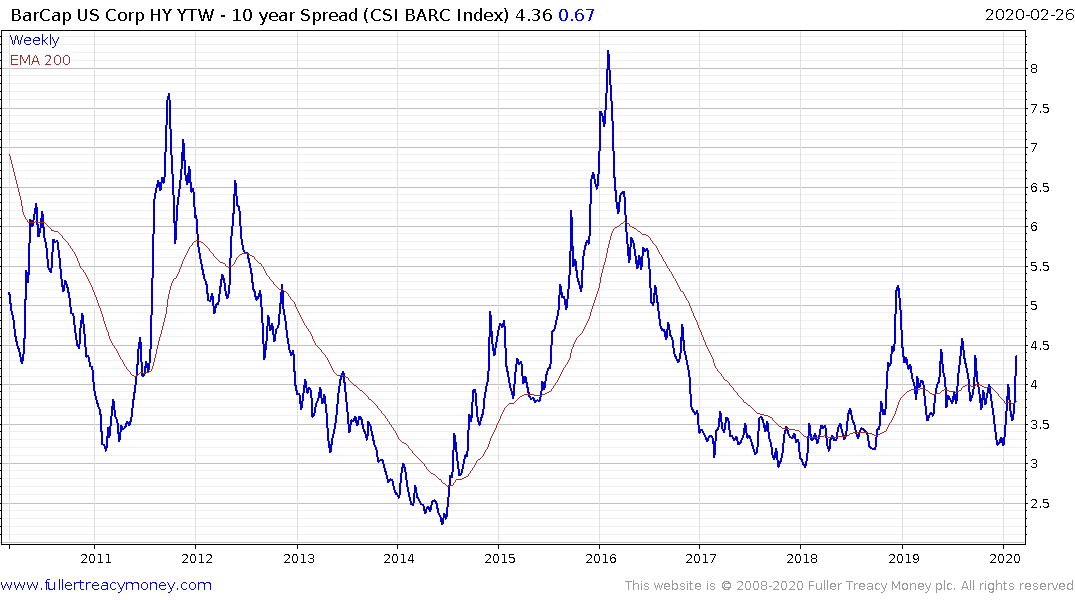
High yield spreads instead are being led higher by energy bonds. The low price of oil represents a significant challenge for already highly leveraged energy companies in the unconventional sector. That suggests the pace of consolidation in the sector is likely to pick up but not before some will go bankrupt.
The primary argument for an economic contraction is the global economy was already weak as a result of the trade war and the impact of the coronavirus will act as an additional brake which will particularly affect consumer sentiment.
Job Openings in the USA are rolling over and the Hard to Find Employees Index is also rolling over. These are important indices to monitor because companies stop hiring before they start firing. The weakness in these indices suggest it is a particularly important time to monitor jobless data.
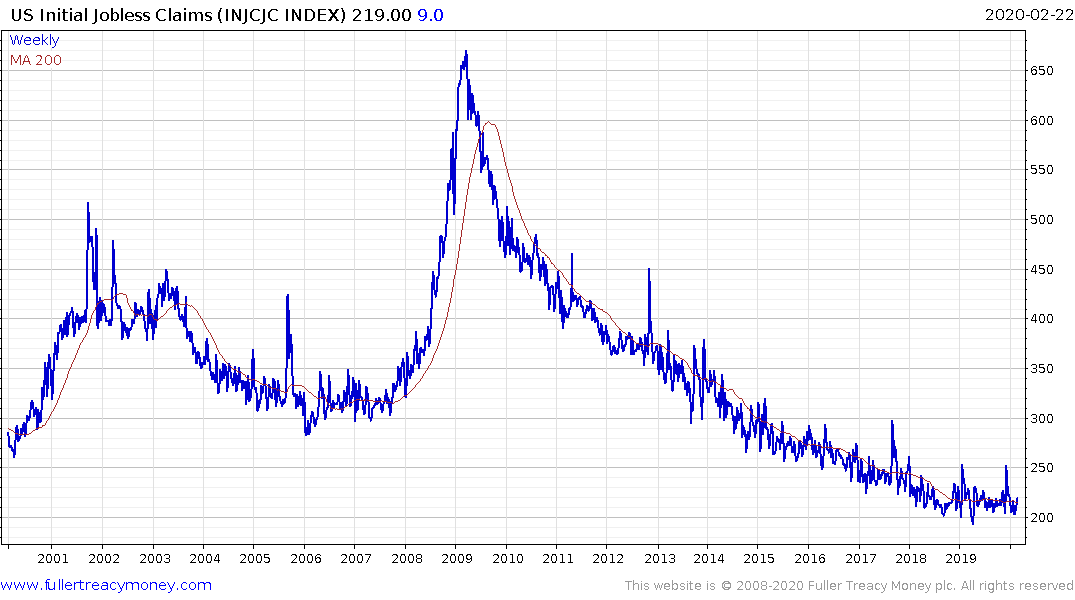
Initial Jobless Claims has been pretty static for the last couple of years but a breakout would be an important warning. You can’t have a recession without people losing their jobs so it is at least a coincident indicator.
.png)
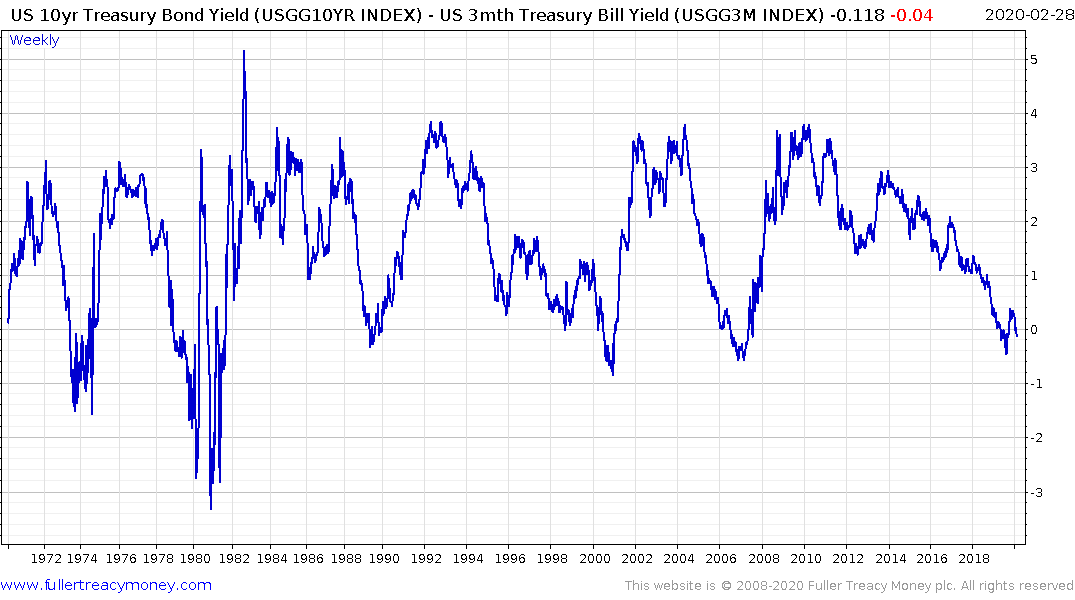
There is a lot debate about the yield curve spread. The 10-year - 3-month has been persistently inverted while the 10-year - 2-year inverted for a couple of days in August and has subsequently popped back above the zero bound.
There have been some false positives for the yield curve signal but there has never a recession without an inversion coming first. The most urgent signal from monitoring the yield curve is when it surges higher following the inversion. That is generally associated with the Fed playing catch-up with the deteriorating economic condition as it slashes interest rates.
While the spread is the most often monitored metric, the shape of the curve is also important. Right now, the yield curve has a significant belly; suggesting imminent rate cuts.
The Municipals yield curve and the junk bond yield curve are trending lower but are not yet inverted.
The US consumer and the willingness to continue spending, come what may, has been a major support for the market and the global economy over the last decade. That is where the coronavirus is a wild card. If schools close, events cancelled and factories shut it is going to shave a significant percentage from economic growth. It that translates into higher unemployment the risk of a deeper pullback will be nontrivial.
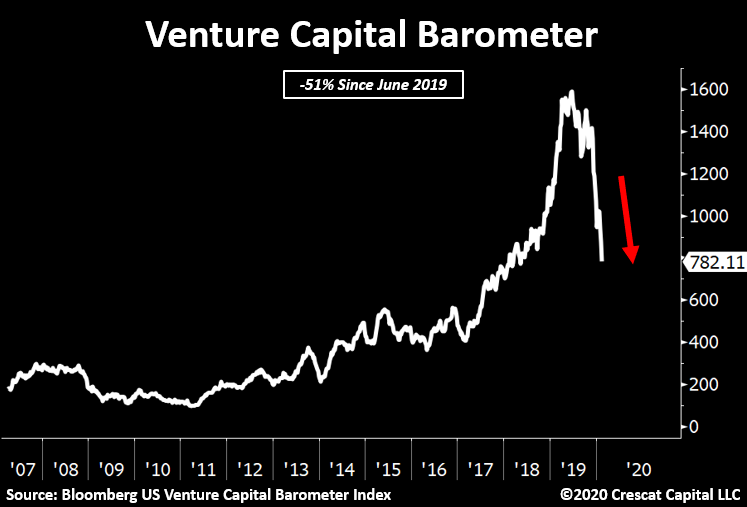
The most important point to remember is where the epicentres of risk are. Everything declined this week which is evidence of contagion selling. However, China and venture capital/private equity are where the biggest risks reside. The halving of the Venture Capital Barometer since last year and the swelling in the number of companies looking to IPO is late cycle activity.
The panicky selling, we are now seeing is reflective of a “sell first, ask questions later” mentality. The primary Wall Street indices have pulled back but not so much that technical damage can’t be repaired. However, it is now for the bulls to prove their case.
Back to top