
Email of the day on the potential for downtrends
Your recent assessments of the markets appear to be that a period of ranging is likely to be followed by markets going up again. Of course, whilst no one knows what the future will be, I wonder why you don't see the greater likelihood of markets turning down after some consolidation. With the amount of US debt increasing, interest rates increasing, and stock market levels already high by historical standards, are you not more concerned that markets, being forwards looking, might be more likely to head down than up? Esp. since markets struggle when interest rates go above 3%? I appreciate your talk of share rotation, but a rising tide lifts all boats and surely the opposite is true when markets tank?

Thank you for these questions which I think everyone asks from time to time. For someone in our position of attempting to forecast the outlook for markets the most important thing we have to remember is that markets rise for longer than they fall but when they fall they often do so quite quickly. However, they do not fall without first exhibiting topping characteristics.
Acceleration is a trend ending, but it’s of undetermined duration. The Dow Jones Industrials Average, in particular, accelerated from the third quarter last year and experienced a sharp pullback two weeks ago. That was a traumatic experience for those who had been tempted to believe stock market volatility has been vanquished and it will take time for sentiment to recover.
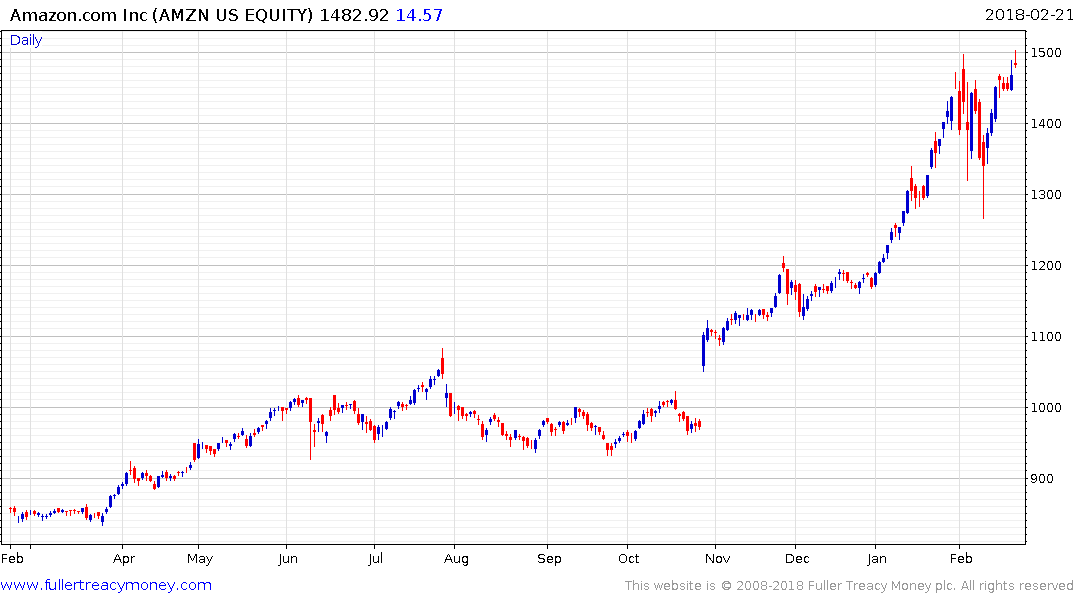
Importantly all of the mega-cap technology shares that have been leading the advance on Wall Street are still trading above their respective trend means and have had some of the most impressive rebounds. Nevertheless, short-term oversold conditions have been replaced by short-term overbought conditions so this is unlikely to be the best time for new money to enter the market.
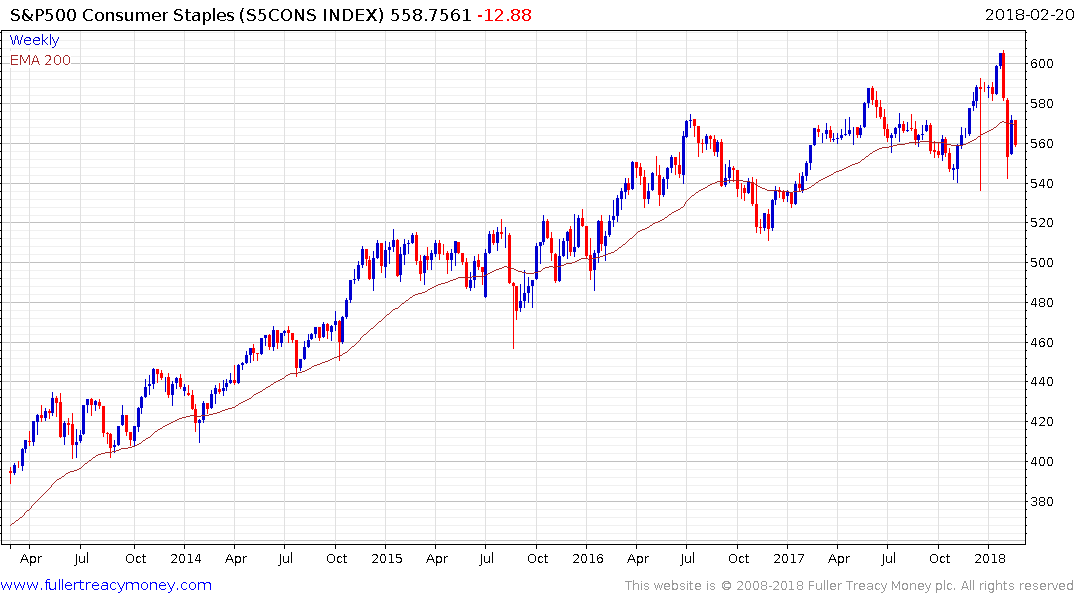
Among laggards, the S&P500 Consumer Staples sector has lost momentum over the last three years. It failed to sustain the breakout to new highs in February, posting a clear downside weekly key reversal, and encountered resistance in the region of the trend mean this week. Consumer Staples were among the primary bullish plays off the 2009 lows because they offered both exposure to the strength of the global consumer and had bond-like cashflows. With fears about the impact of higher yields weighing on bond proxies, the sector is susceptible to yield expansion that would take it back to levels that are competitive with bonds.
These two charts highlight not only the rotation underway but deteriorating breadth. Both of these points could contribute to addition ranging for the primary indices.
Meanwhile here are the charts I am looking at before I turn even more cautious on the overall outlook for the stock market.
The stock market will probably lose momentum ahead of the next recession so we have to at least be alert to the possibility that any range that evolves will need to be orderly if top formation is to be avoided. However, a stock market peak of importance for medium-term to long-term investors as opposed to traders is unlikely to form in isolation. There will be other factors at play and interest rates will certainly be one of them.
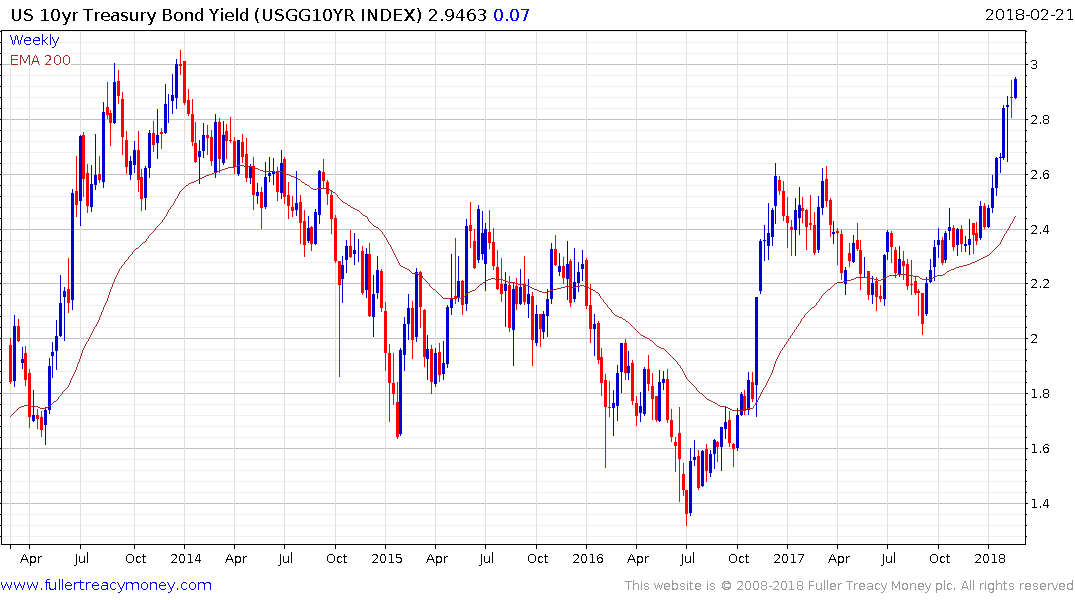
10-year yields are still trading below 3% and a sustained move above that level is going to be required to signal more than short-term supply dominance. The arguments for why yields should be trading above 3% are well made considering the quantity of bonds the USA will be issuing over the coming years. Most of that debt is at shorter maturities so it stands to reason that the best place to monitor selling pressure is at those shorter maturities. 2-year yields for example continue to march higher.

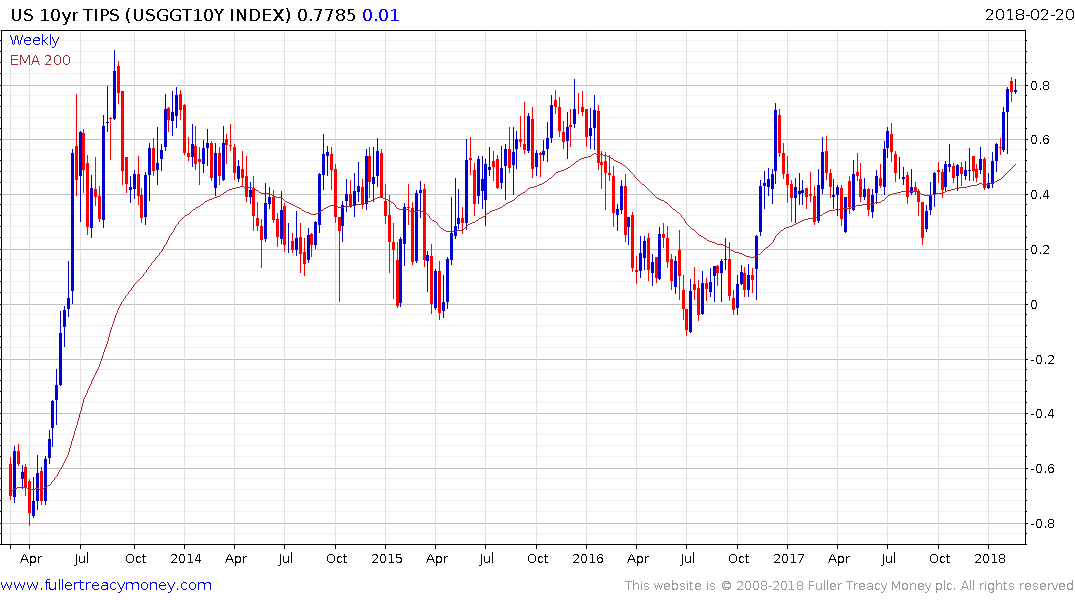
By the same token, there is no additional supply of TIPS expected over the course of the year. I wouldn’t be issuing TIPS either if inflation is due to increase but does suggests they are a good measure of the market’s inflation expectations.
.png)
That selling pressure at the short end is leading the yield curve to contract again from its recent high near 80 basis points. However, the spread would need to invert to signal a lead indicator for a recession.
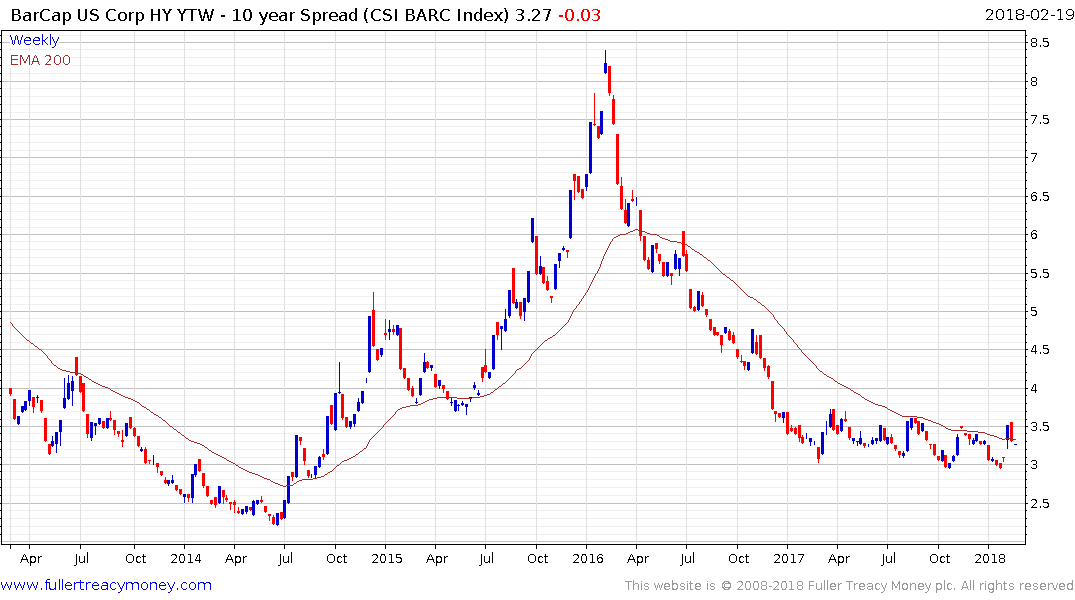
High yield spreads are still very low. It generally isn’t until they have been trending higher for a few months that the stock market runs into trouble. The last example of high yield spreads widening contributing to a more rangey, volatile environment on stock markets was in 2014-16.
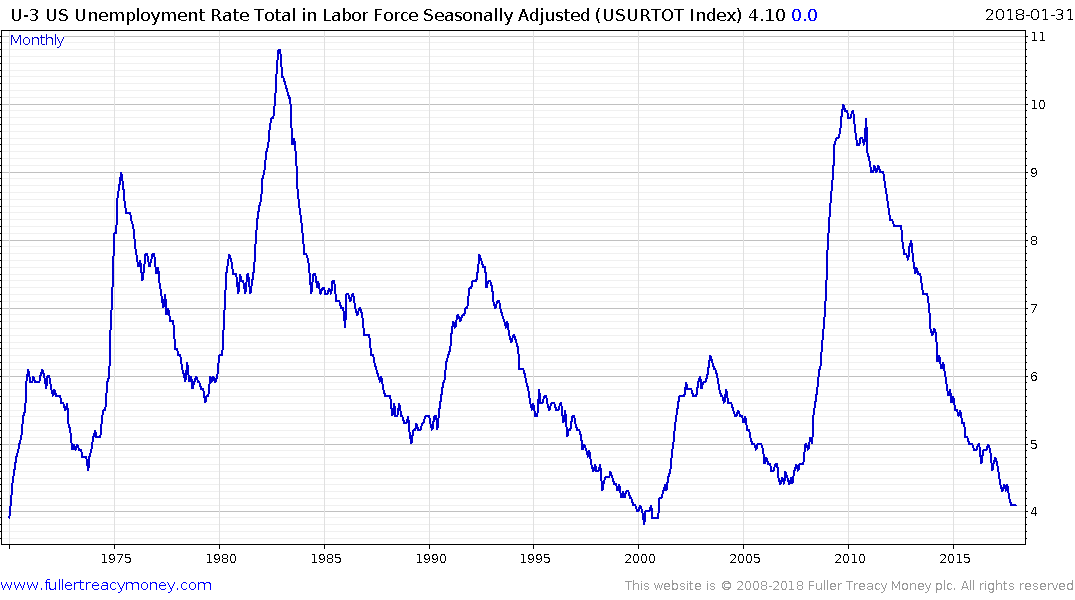
Unemployment is still trending lower and, admittedly, it is already close to historical lows in the USA, but it is not until unemployment starts to trend higher that it represents a lead indicator for a future recession.

Crude oil is steady above $60 but it is not surging higher which historically has been a harbinger for economic trouble.
Credit Card delinquencies are something I have been paying attention to recently because so many people bought cryptocurrencies after Thanksgiving on credit, that the major card issuers stopped processing payments in January. Bitcoin has bounced back over the last two weeks but today’s $1000 drop suggests the short covering rally may be running out of steam. If credit card statements from late last year are being paid now the majority of people could get out square, but credit card delinquencies will give us a clue into how deeply the bitcoin crash has affected the consumer.
If we take all of these potential lead indicators in aggregate then they suggest we might be in a mature stage of the medium-term cyclical bull market but that it is not yet over. The stock market action continues to point toward narrowing breadth, rotation and ranging but it is too early to take about top formation development much less completion. Obviously, this is an evolving situation so I will make every effort to keep you posted.
Back to top