
Email of the day on the Dow/Gold miners ratio
You have cited the Gold/Dow relationship and how if this ratio was to do what it has in the past, Dow has lots of upside versus gold. However, Jesse Felder sees it just the opposite. Not sure why your tow ratio charts would be opposite. Here is a link to the public post.

Thank you for this email which may be of interest to other subscribers. In the Big Picture Long-Term audios and videos, I tend to use the Dow/Gold ratio over the course of the last century because it gives us a graphic illustration of how stocks outperform gold in secular trends but gold outperforms stocks following stock market peaks.
The last major peak was in 1999 for stocks and gold appreciated for 10 consecutive years while the stock market went broadly sideways. The ratio registered another important low in 2011 when the Dow was only trading at 6.7 times the price of gold.
Since then the Dow has outperformed by a wide margin but even a secular trend is going to be punctuated by occasional exchanges in relative positioning. I found the charts in the attached article confusing but feel it is important highlight the difference between the Dow/Gold ratio and the Dow/Gold Mining shares ratio.
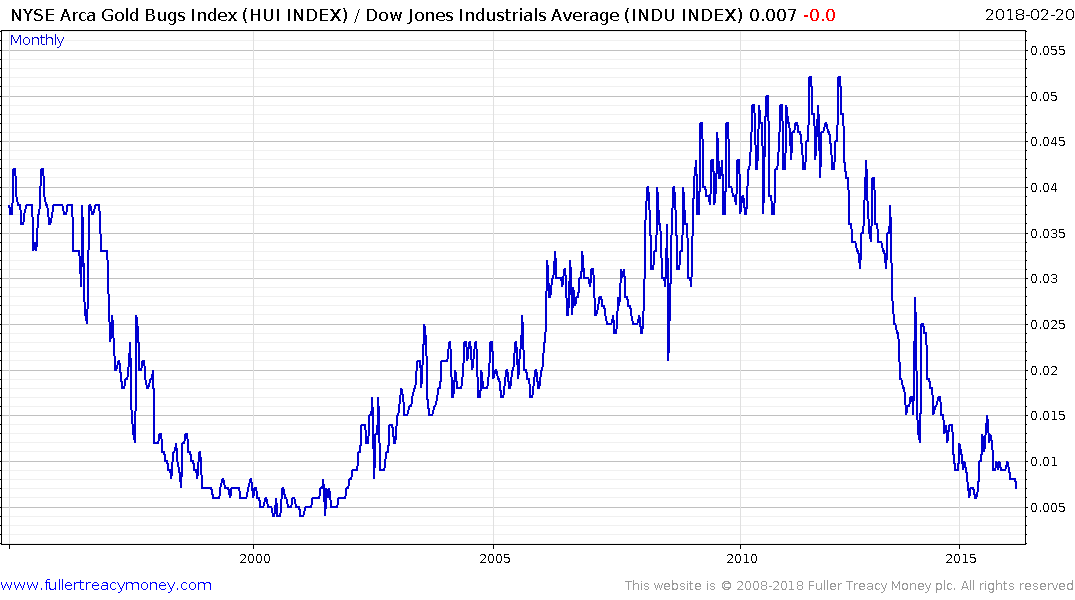
Gold mining shares are back at levels relative to the Dow Jones last seen in 1999. If gold prices do in fact break out then gold mining shares are in a position to offer a high beta play because they have been through a traumatic rationalization and are now focusing more on free cashflow than expansion.
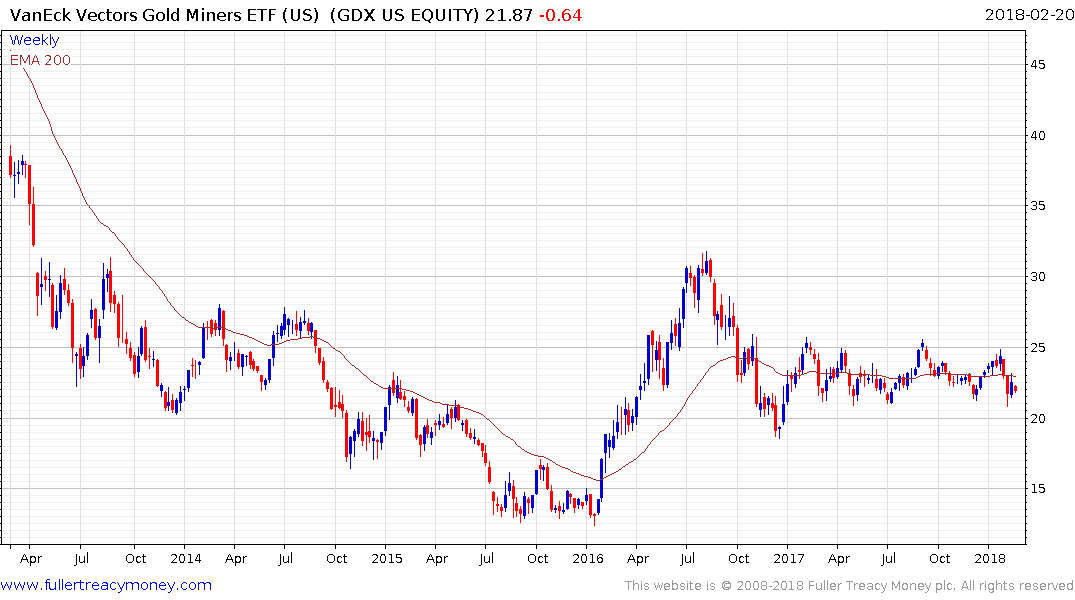
The VanEck Vectors Gold Miners ETF has been ranging in an inert manner for a year but will need to sustain a move above $25 to confirm a return to demand dominance.