
Wall Street's Pile of Unwanted Treasuries Exposes Market Cracks
This article by Alexandra Scaggs and Liz McCormick for Bloomberg may be of interest to subscribers. Here is a section:
There are signs that the dislocations have abated. The gap between prices of new and old securities has fallen closer to its average for the past year, and in the repo market, 10-year Treasuries are no longer what’s known as “on special.” Dealers that lend cash in exchange for the notes in these deals now receive interest, since the repo rate is positive.
Bond bulls can also take heart in how the stress on the system didn’t slow the rush into U.S. government debt this year. Treasuries maturing in greater than a year have earned 1.7 percent in 2016 as stocks slumped to start the year amid concern global economic growth was cooling, Bloomberg Treasury bond index data show. The Treasury 10-year note yield rose four basis points, or 0.04 percentage point, to 1.91 percent as of 1 p.m. New York time.
In a twist, the demand for U.S. debt that drove 10-year yields toward record lows in February may have contributed to the strains, Keeble said. Buyers of Treasuries who typically don’t lend out securities in the repo market may have bought benchmark 10-year securities as a haven, he said.
For George Goncalves, head of rates research at primary dealer Nomura Securities Inc. in New York, dealers already holding so much debt may have less capacity to absorb more rounds of selling in the future.“If there is another round of bond selloff, the market will need real-money support to keep everything orderly,” he said in a March 17 research note.

Quantitative easing has had a massively distorting influence on the bond markets because the Fed is now the largest owner of whole issues which has an influence on the yield curve. Selling pressure from foreign governments and sovereign wealth funds left primary dealers with bloated inventories of Treasuries they had difficulty shifting but the question of what the Fed is going to do with its massive holdings of bonds when they mature remains an open question.
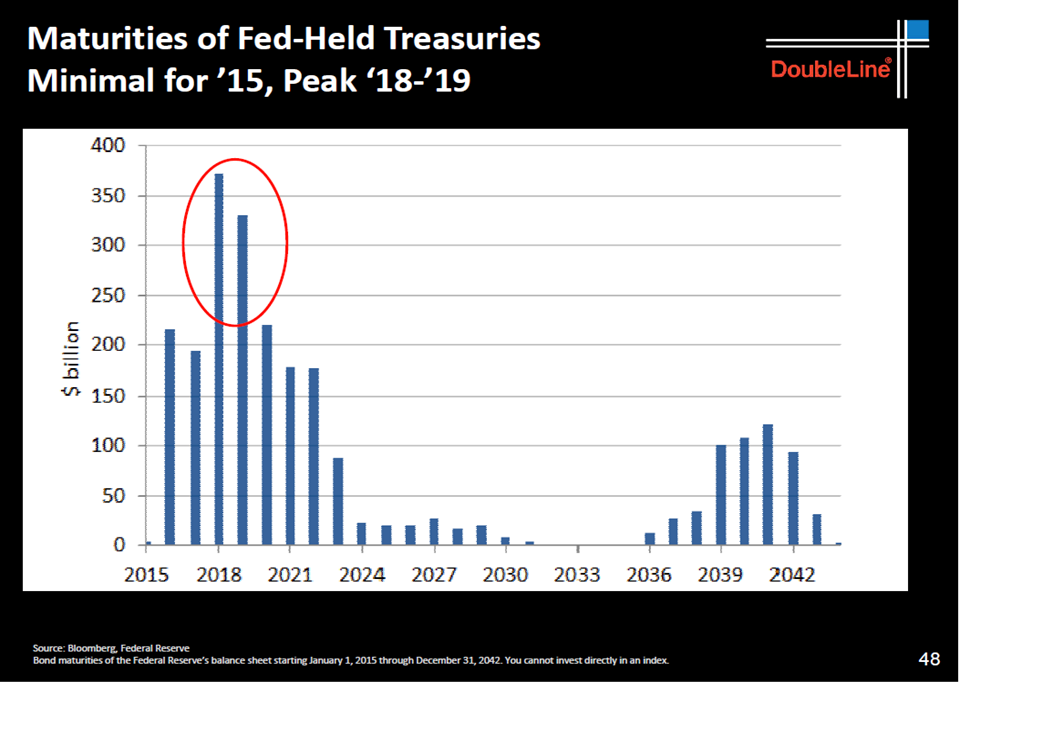
According to the above graphic from DoubleLine the Fed has approximately $200 billion in bonds maturing in 2016 and 2017 and it rises to close to $350 billion for 2018 and 2019. Quite apart from the ongoing funding requirements of the US government, the Treasury has to refinance $200 billion this year and that represents a significant chunk of debt for the market to absorb.
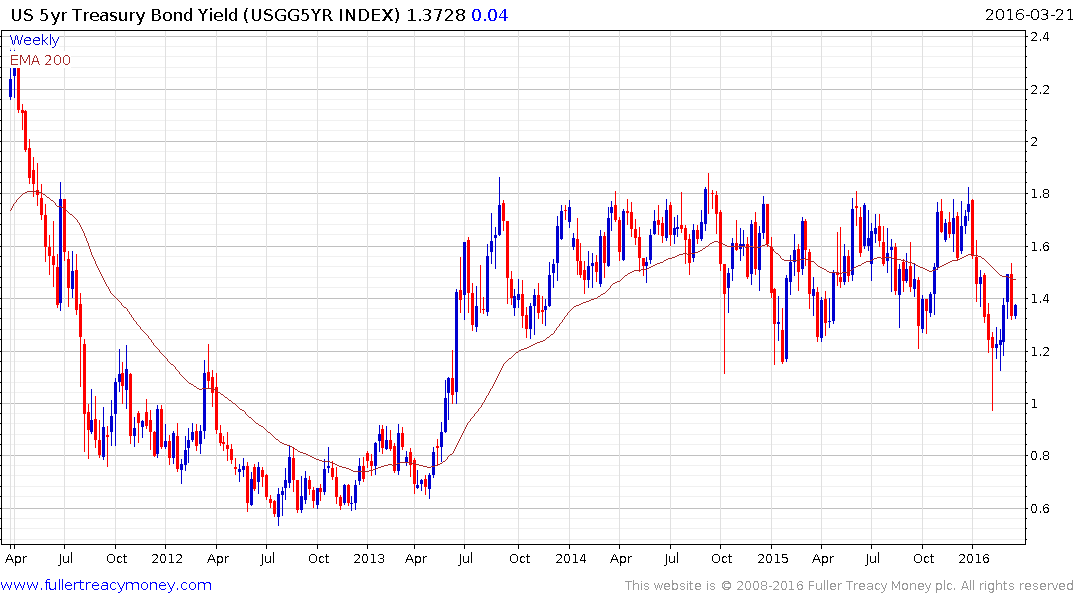
Due to the maturity extension program the majority of these holdings have maturities of between 3 and 7 years so the 5-year is likely to be an important benchmark to monitor over the coming years. The yield bounced from the 1% area in early February to form a failed downside break and has now rebounded to test the region of the trend mean where it posted a downside key day reversal last week. That suggests resistance in the region of the MA and some ranging appears likely in the current area.
.png)
Longer-term the chart has the appearance of a first step above the 2012/13 base and a sustained move below 1% would be required to question that view.
Back to top