
US Shale Shock and Dutch Disease; BoJ Shock and Awe
Perhaps the most direct effect on the US economy from the shale energy revolution will be through net exports. Given the projected rise in US oil and natural gas production, energy imports relative to demand are projected to decline sharply from about 22% in 2010 to 9% in 2040 (Chart 18). The significant increase in shale natural gas production, and the subsequent shift in the electrical power sector toward natural gas, has increased US coal exports (Chart 19). While only about 3.5% of US coal production was exported in the early 2000s, 12% of coal production was exported in 2012, and this fraction is projected to approach 14% by 2040. The boom in US natural gas production has prompted natural gas import terminals to shift their infrastructure into export terminals and is also expected to swing the US from a net importer of natural gas to a net exporter in the coming decade (Chart 20).
The impact on net exports has not been limited to natural gas; oil imports have also declined substantially relative to US demand (Chart 21). While net oil imports equaled about 60% of US demand in 2005, only about 40% of demand was met by net oil imports in 2012, and the EIA projects that this lower level will persist over the next several decades. In addition, the US has quickly become a net exporter of refined products (Chart 22).

Eoin Treacy's view We have long described the USA's unconventional
oil and gas revolution as a game changer for the energy sector. As the USA moves
to an export footing for a number of energy related products and commodities,
the impact of a major importer turned exported should become a headwind for
global pricing of these commodities.
A less remarked result of the USA's energy revolution has been on the Canadian
energy sector which has classically depended on the USA as an export market.
With the USA now self-sufficient in natural gas and oil production continuing
to trend higher this represents a significant challenge for Canadian companies.
The USA has been slow to permit LNG export facilities. While a number are proposed,
Cheniere
Energy's Sabine Pass operation is still the only fully permitted facility
but is not expected to come into operation until Q4 2015. Even if other permits
are granted they will probably come into service even later than that.
Developing additional markets for Canadian energy products is now a national
priority. This helps to explain why two
projects are now under construction in British Columbia. Shell, Korea Gas
Corporation, Mitsubishi and PetroChina Company Ltd are scheduled to build one
which is due to come into operation from 2020 while Chevron and Apache are building
a smaller facility. Considering the long lead times for these projects it is
little wonder that the Keystone pipeline is such a priority for Canadians.
I last reviewed Canadian oil and gas companies with a focus in British Columbia
and Alberta on June
13th 2012. Since then the pace of M&A activity has increased. Petronas,
Malaysia's state oil company completed a takeover of Progress Energy Resources
Corp in February. Exxon Mobil acquired Celtic Exploration in March.
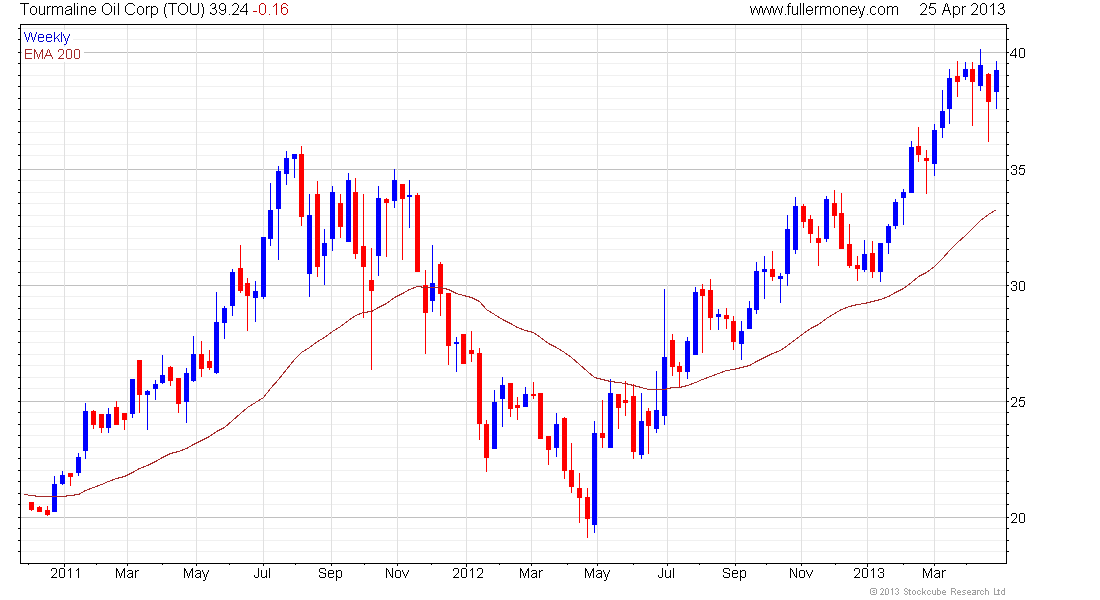
Tourmaline
Oil Corp and Peyto
Exploration & Development Corp continue to trend consistently higher.
Breaks in their medium-term progressions of higher major reaction lows would
be required to question potential for continued upside.
Paramount Resources has been mostly rangebound
for two years but has been finding support in the region of the 200-day during
pullbacks since January and bounced from the trend mean last week. A sustained
move below CS$33.30 would be required to question medium-term scope for continued
higher to lateral ranging.
Birchcliff Energy has held a progression
of higher reaction lows since July 2012 and is currently testing the 200-day
MA near C$8. Bonavista Energy Corp will
need to sustain a move above C$16 to break the two-year progression of lower
rally highs and suggest a return to demand dominance beyond the short term.