
Richemont Drops on Signs Luxury Demand Is Weakening in US, China
This article from Bloomberg may be of interest to subscribers. Here is a section:
Richemont led luxury-goods stocks lower amid concerns that demand in the US and China, two of the biggest markets for the industry, is starting to sputter.
The Swiss owner of Cartier reported a surprise drop in revenue from the Americas in the three months through June.
While Richemont’s sales from Asia rose sharply, China reported slower-than-expected economic growth Monday, signaling signs of a possible pullback in consumer spending.
Richemont fell as much as 8.2%, the steepest intraday decline in more than year. LVMH dropped as much as 3.7% and Hermes fell as much as 4.2%.
The luxury-goods industry has been counting on a rebound in China after that country’s reopening would make up for weakness in the US market. Now Richemont and its peers are contending with the prospect that its two main growth motors are weakening.
Last week, Burberry Group Plc said the low end of the luxury market in the US softened.

Aspirational spending is heavily dependent on disposable income and availability of credit. The luxury goods sector thrived during the pandemic because consumers were flush with cash and had fewer options to spend it since travel and sports events were shut down. The sector leaped higher again when China’s lockdowns ended because investors were betting the post pandemic celebratory spending would be repeated. That has not been the case.
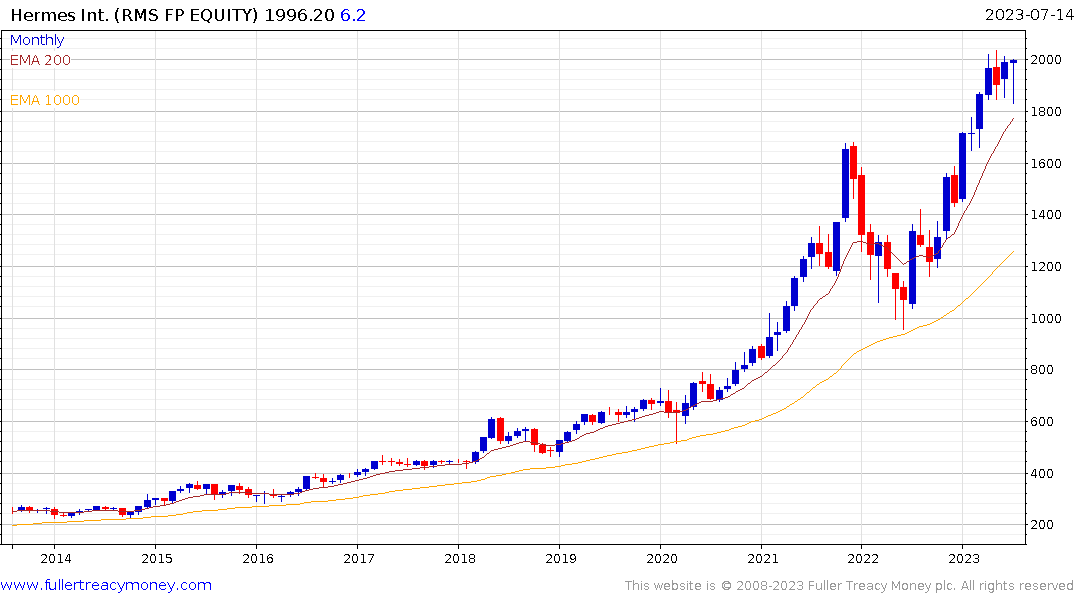
Hermes has one of the most consistent chart patterns in the world. It has never sustained a move below the 1000-day. The challenge at present is the share could halve and would still only approximate the level of the MA. That suggests this is a particularly inopportune time to initiate a long position.
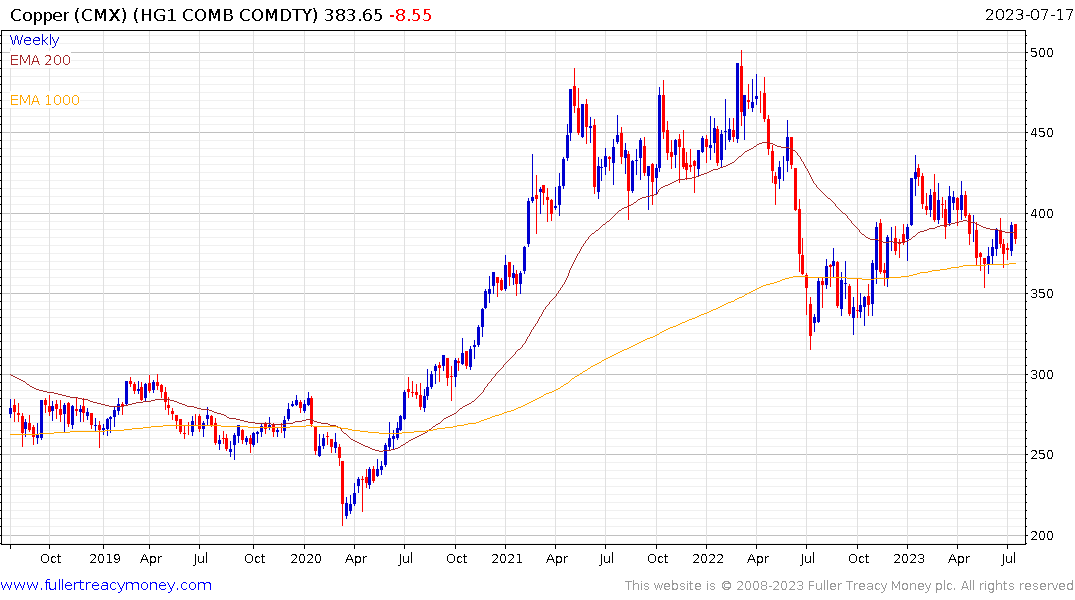
Copper is also experiencing some of the side effects of weakening expectations of Chinese stimulus. The longer-term chart continues to exhibit Type-2 top formation characteristics with right-hand extension. That’s a bearish chart set up even if the long-term outlook is likely to boost demand from renewable energy investments.