
Musing from the Oil Patch June 27th 2016
Thanks to a subscriber for this edition of Allen Brooks’ ever interesting report for PPHB. Here is a section:
This inverse relationship between the value of the U.S. dollar and the price of crude oil has been very clear for most of this century. Will it continue in the future? More than likely it will, partly because, while the relationship is logical, it has become a short-term trading indicator. In the past several weeks, after WTI reached and surpassed the $50 a barrel threshold, one could virtually answer the question of what happened to oil prices each day if you were told what happened to the value of the U.S. dollar that day.
After watching this ying and yang of oil price movements and the value of the U.S. dollar, we were interested in the two-page chart on the profits of the Fortune 500 companies by sector over the past 20 years. We cut out the pages and scanned the chart (Exhibit 7 below), shrinking it to fit on one page. Unfortunately, we lost the 1995-1996 part of the chart, but the visual impact of the chart remains relevant.
What struck us while looking at the chart was the huge bulge in energy profits during 2005-2012 before they started contracting and then collapsed after oil prices dropped at the end of 2014. The Energy sector profits during that period were driven by high oil prices - $80-$100+ per barrel, even after adjusting for the 2008-2009 financial crisis and recession. As Energy profits mushroomed during the era of high oil prices and the shale revolution, it was easy for Wall Street to convince investors to throw money at exploration and production and oilfield service companies who were leading America to the promised land of energy independence. The Energy stocks were soaring as analysts and investors fell in love with the shale revolution that married horizontal drilling with massive hydraulic fracturing to produce huge volume of natural gas, natural gas liquids and tight oil. Remember that it was during this era that we were assured that we had hundreds of years of cheap natural gas supply. One Wall Street firm even wrote a report explaining how this revolution was turning us into ‘Saudi America.”
The chart shows clearly what happens when an ill-founded boom collapses. As you scan the lower right hand corner of the chart, it is very difficult to see the thin black line reflecting current Energy sector profits, or what is left of the thick line that existed throughout most of the 2000s. In fact, if oil prices hadn’t climbed back to $50 recently, it is possible that the thin line would become impossible to see as there wouldn’t be any profits. Many investing in Energy today are hopeful that one day in the foreseeable future that thin black line will once again become a thick black line. We are comfortable is saying the line will be thicker, we just don’t know how thick it will eventually grow and when that will be.

Here is a link to the full report.
The Dollar Index failed to sustain the move below 92.5 in May and has now bounced back above the 200-day MA. Considering the size of the upward dynamic a retest of the upper side of the 18-month range, near the psychological 100 is now looking more likely than not.
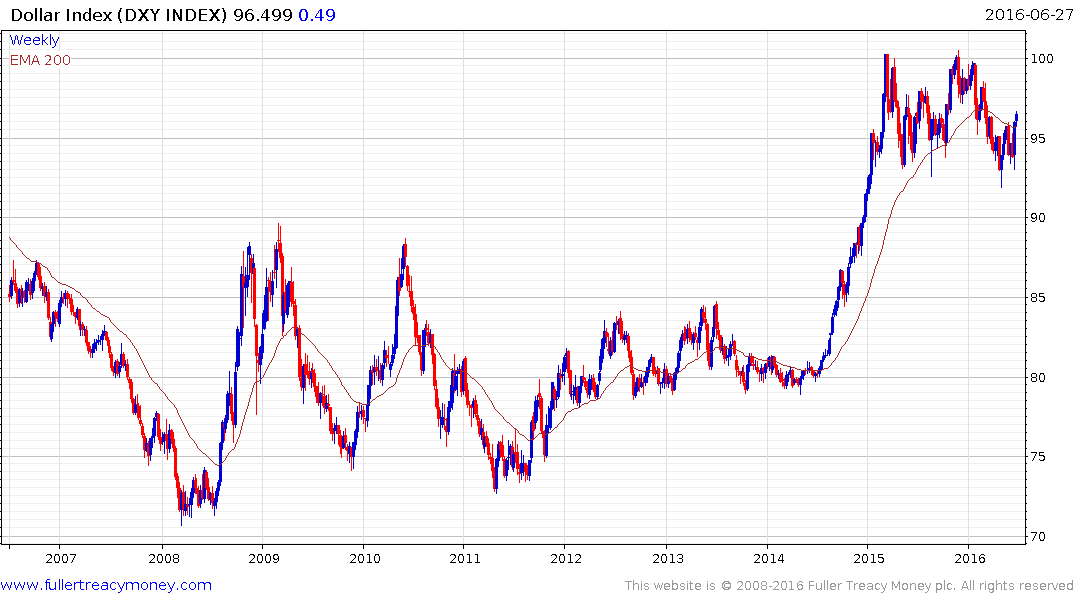
While the relationship between the Dollar and oil prices is far from a 1:1 correlation, the relative strength of the greenback acts as a headwind for oil. This is particularly important right now because Brent crude has been trending so consistently since finding a medium-term low in February.
Reactions have been limited to less than $6, but prices are now testing last week’s low. A sustained move below $46 would break the sequence of higher reaction lows, represent a larger reaction and break back below the trend mean. As a result, the most likely conclusion would be that oil’s rebound is over and a deeper corrective phase is unfolding.
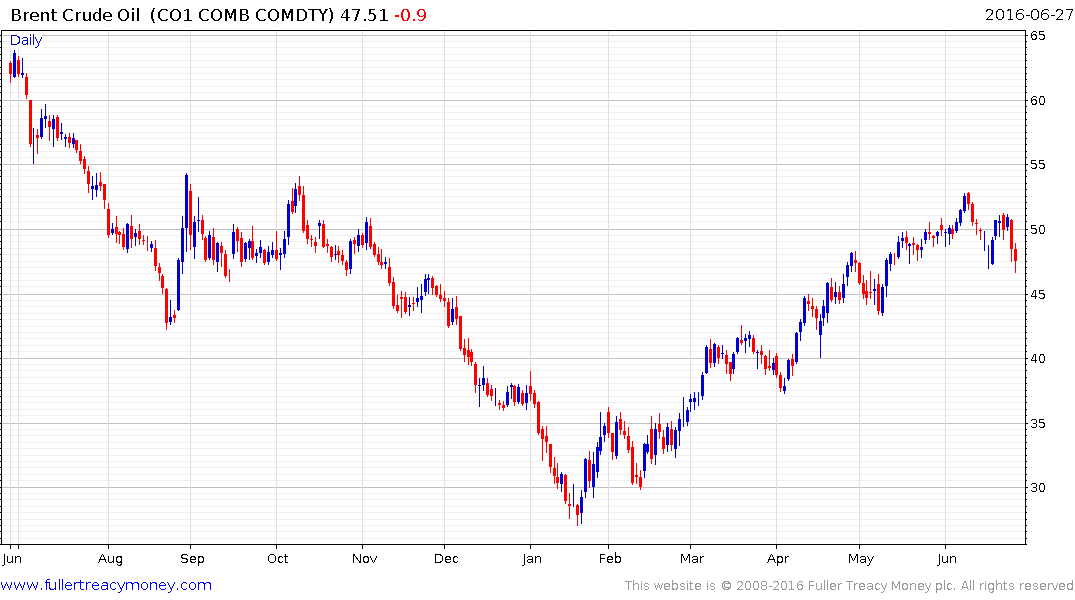
If oil prices do in fact roll over it would remove an important support for the stock market rallies which have been in place since the January low not least because energy is a large cap sector and has been among the best performers year to date.