
Investors becoming convinced bond yields have seen their lows? again!
Thanks to a subscriber for this report from SocGen which may be of interest to subscribers. Here is a section:
An integral part of our Ice Age thesis has been to overweight longer dated government bonds as deflation becomes an ever more immediate threat. That strategy has produced superior returns, even relative to global equities. Clearly at some point this 33 year bull market in government bonds will end, but why are market commentators just so keen to pronounce its demise? It is because the continued bond bull market mocks the paucity of the recovery with its accompanying deflation, thereby threatening the asset class they really want to be bullish about ? the equity market.
I have read a lot of very convincing commentary in recent weeks to the effect that we have seen the lows for 10y+ government bond yields with various explanations surrounding the dollar?s recent decline and the recovery in the oil price, etc., etc. And to be sure we did certainly enter some sort of twilight world recently when German 10y yields sank to 0.05%. The sharp dip in German yields below Japanese yields, even at the 30y end of the curve, was also accompanied by a bizarre dive in Spanish yields well below the US ? a curious state of affairs indeed. All that has happened though over the past few weeks is that some sort of normality has been restored (see chart below).
I do not see this as the end of the bull market for long government bonds. Despite the oil price rise, core inflation remains extraordinarily low at a time when the global economy is still struggling to gain traction. Aside from continued growth disappointments in the West, the outlook for the oil price and the Chinese economy will be key. And on that latter score we remain far more concerned about China than most market commentators. And notwithstanding the (over)-confidence evident among central bankers, Europe and the US remain only one recession away from outright deflation.

Here is a link to the full report.
This is a big question and it wouldn’t be a market without some disagreement but we rely on the price/yield action to justify our view. If we look at the economic data we are presented with, it would be easy to conclude that there are deflationary pressures and yet if we look around there is evidence of new wage demands which are a major source of inflationary pressure. If I think about the people I know who have moved jobs, it was not because they had to move but because they were enticed with a better pay offer elsewhere. With so much debate I believe it is more important than ever to have some long-term perspective.
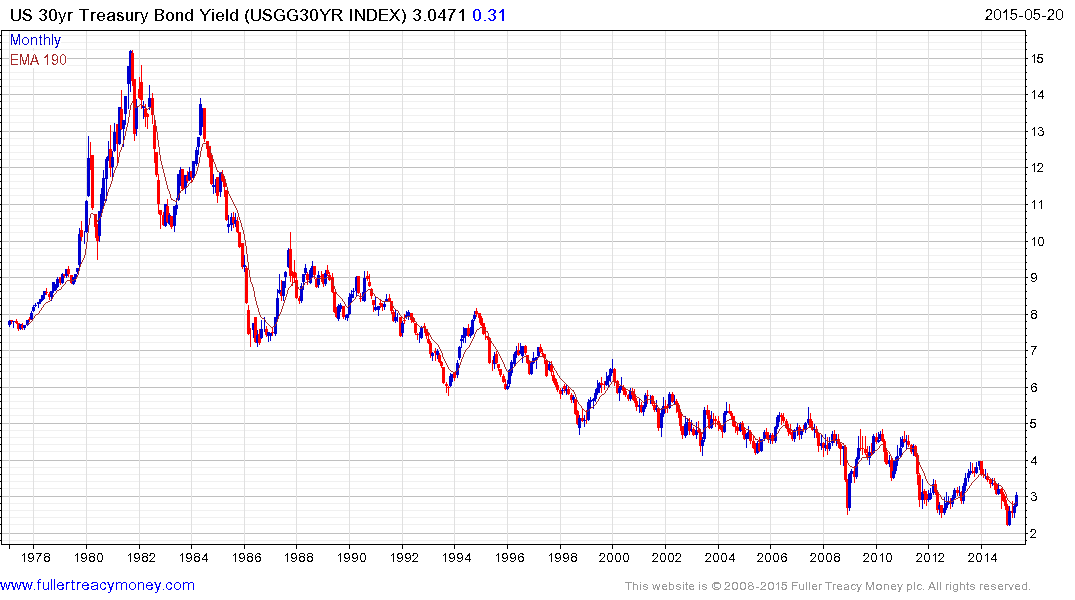
30-year yields has been trading lower since the peak in 1981. A rivetingly consistent progression of lower rally highs is evident, with the most recent in the region of 4%. Anyone who has bought bonds when that progression of lower rally highs has been tested has made money over the last 34 years. If the secular trend has turned, that strategy will stop working.
.png)
With such a long-term chart the log scale offers some additional perspective. Volatility has increased substantially since the credit crisis. The breakdown to new lows in January has since failed and, as we teach at the Chart Seminar, a failed break suggests that the other side of the range will be tested. The most likely scenario is then that the 4% level will be tested and it will be for the bulls to prove they have the wherewithal to demonstrate dominance at that level.
An additional consideration is that the move to new lows in January was accompanied by record inflows to long-dated bond funds. If yields get to 4% the investors who bought at record lows in such numbers will be sitting on major losses. It is therefore questionable that there will be sufficient demand to reignite investor interest but we will see.
.png)
Since yields are so low it is also instructive to look at the price charts of individual bonds. The 3.75% 2043 Treasury has lost uptrend consistency. While there is potential for some consolidation a sustained move above 120 would be required to question potential for a further test of underlying trading.