
How Conditions Today Compare to Past Equity Market Bottoms
Thanks to a subscriber for this report from Bridgewater which may be of interest. Here is a section:

Here is a link to the full report and here is s section from it:
Global equity markets are down more than 17% this year as central banks responded to strong inflation with a record pace of tightening. Have stocks fallen enough to see the bottom in the market, or is more pain ahead? One perspective we have found helpful when considering this question is comparing conditions today to past inflation-driven equity market bottoms.
Bear markets typically unfold in a sequence: 1) rising interest rates push down equity prices, as any future cash flow is discounted to the present at a higher yield; 2) higher rates and growing economic uncertainty draw money out of risky assets, depressing equity prices further as risk premiums rise; and 3) the combination of the impact of rising discount rates, risk premiums, and declining asset prices leads to declining economic activity and earnings, creating more downward pressure on equities.
The equity bottom typically does not come until 1) there is a meaningful period of easing sufficient to offset the negative economic momentum, and 2) equity prices fall enough that investors are incentivized to move back out the risk curve and buy stocks. The former typically means that central banks assess that the slowdown in economic activity has been large enough to bring inflation back under control. And the latter means equities typically decline much more than justified by higher interest rates, resulting in valuations that are low enough to draw investors back in.
When we look at conditions today, the typical markers of an equity market bottom are not yet present. Inflation remains very high, and the economy remains relatively strong, such that a Fed easing does not seem likely (currently the Fed has only indicated that it will slow its tightening). And despite the drop in equity prices, long-term equity expected returns still look poor compared to bonds and cash—meaning investors still lack a strong incentive to jump back in. The Fed will likely need to see more weakness—and investors, lower prices—before equities find a floor and begin a sustainable climb.
.png)
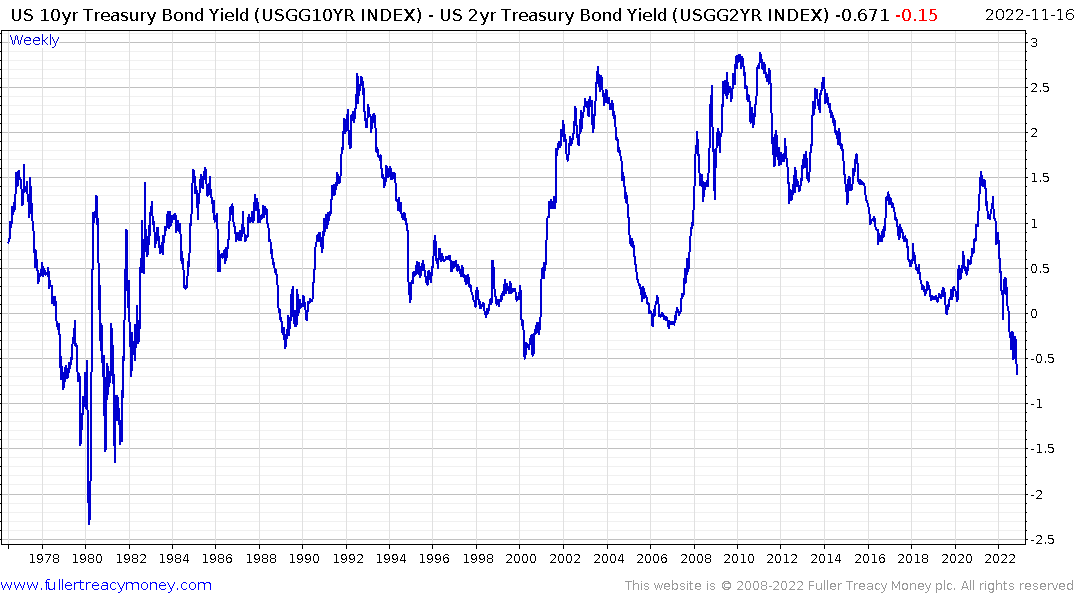
The yield curve spread is about the easiest way to monitor the progression of the bearish cycle. Whether one looks at the 10-year-2-year or the 10-year – 3-month is less important than the fact that contracting yields curves imply liquidity is becoming progressively less accommodative.
If stage 1 of a bear market is rising interest rates introducing a progressively higher discount rate, we have already seen what that does to asset prices this year.
The liquidity issue in the UK pension system, the demise of FTX and the ripple effects they are causing, are signs that money is being withdrawn from speculative strategies. There have also been several instances where companies are refusing to call their perpetual bonds. Since many investors expect the perpetual to be called at the end of the low interest rate lockup that greatly increases the duration of their portfolios. All of these examples suggests we are currently in the 2nd stage of this bear market. https://www.bloomberg.com/opinion/articles/2022-11-13/credit-crises-lurk-in-emerging-markets-not-just-china?utm_medium=email&utm_source=newsletter&utm_term=221114&utm_campaign=sharetheview&sref=g4EhC0E7
The third stage is when tightening liquidity takes a bit out of economic activity and corporate earnings. The temptation at present is to look at P/E ratios and conclude this is a clear value opportunity in the market. The risk is the E takes a hit and valuations increase which erases the value argument. That’s usually the biggest shock in a recession and is why the drawdowns tend to be surprising.
The response to slowing economic activity is lower short-term interest rates. That usually results in a lurch higher for the yield curve spread and tends to coincide with a meaningful stock market drawdown. The ultimate low tends to occur when the spread has increased to at least 250 basis points. That suggests it is still too early to go all-in on the best the stock market has bottomed in aggregate.
However, it is also worth considering that the sectors which will lead in any new bull market will bottom ahead of the market and will likely put in higher reaction lows when the wider market makes new lows. That will be the clearest signal to monitor for signs of early leadership.
Back to top