
Gold helped by USD pullback and safe haven flows
This report by Joni Teves for UBS may be of interest to subscribers. Here is a section:

Here is a link to the full report.
Here is a section from the report:
Trade policy concerns affect gold via the dollar, inflation and economic impact Gold has managed to bounce back from recent lows, helped by a pullback in the dollar and likely some safe haven flows on the back of concern about global trade relations. This matters for gold to the extent that it impacts the dollar, inflation and inflation expectations, the economy and in turn, monetary policy. With regard to steel and aluminium tariffs, further details of which are expected this week, our US economists expect the administration to take a slightly lighter stance than what was proposed by the Commerce Department to limit negative impact on the broader economy. Should the decision be in the range of the recommendation, the aggregate economic effect is expected to be small. UBS' US Office of Public Policy views that these new tariffs are likely to lead to retaliation from the US' trade partners, but these are unlikely significant enough to cause a broader 'trade war'.
Lighter positioning should help gold and silver Changes in precious metals positioning were mixed as of February 27, according to latest data from the CFTC. Gold and silver net longs declined while platinum and palladium net positions increased. The pressure on gold prices over the past week or so coincided mainly with long liquidation, taking net positioning to 20.49moz or 55% of the all-time high. Short-selling contributed to the heaviness in the market – gross shorts increased for the first time in four weeks and increased by the most since the start of the year. Given price action later in the week, which the data doesn't capture, we suspect the next CFTC report would show further reductions in net length. This should offer some support in the near term and help contain the downside as we expect some further pressure to come in the lead-up to the March FOMC meeting and as seasonal physical demand fades. Silver net speculative positions were also down, marking the fourth straight week of declines. Pressure on silver all came from short-selling, with only a minor offset offered by a modest build in gross longs. Silver continues to underperform, with the ratio holding above 80 since early February. Although steady global growth should bode well for silver industrial demand, fundamental catalysts are currently not strong enough to encourage more active investor participation in silver. Pressure on gold, weakness in equities and softer commodities have likely weighed considerably on silver of late. The only noticeable supportive factor for silver right now is positioning – net longs at 71.82moz are only 12% of the record and gross shorts are relatively elevated at 80% of the high. We think this makes silver more vulnerable to upside catalysts, which we suspect are more likely to come from gold.
Gold has seen some of its thunder stolen by cryptocurrencies. Meanwhile, the negative real interest rates it hedges against have been slow to materialize, with the result that the price has been largely rangebound for five years.
The countertrend rally in early 2016 is likely to have been the pivotal point in the reversal of gold’s fortunes. That massive reaction against the prevailing downtrend had type-2 trend ending characteristics. It is quite normal after such a move that an extended period of ranging above the lows unfolds and that is exactly what has occurred over the last couple of years.
Gold continues to firm from the $1300 level and a sustained move below it would be required to question medium-term scope for continued upside.
Another point we cover at The Chart Seminar is that ranges are explosions waiting to happen. Gold has been contained below $1400 since 2013 so when a breakout eventually comes it is likely to be surprising in its ferocity. The reason many veteran gold investors were so happy to sit through lengthy consolidations in gold during the bull market was because of its propensity for explosive breakouts.
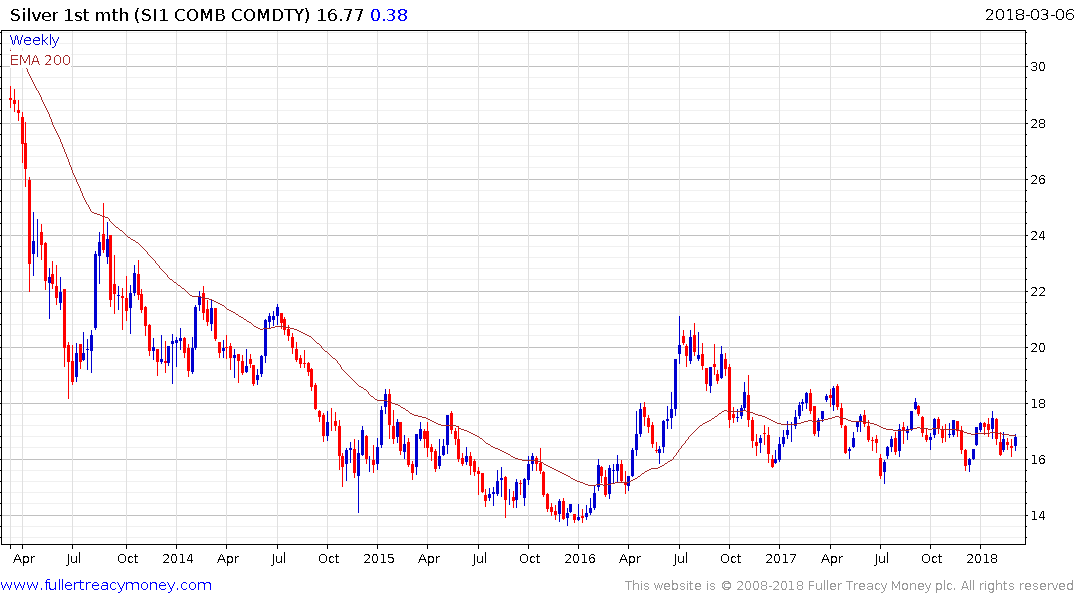
Silver has long been thought of as high beta gold. It has been ranging with a mild downward bias since the mid-2016 peak and will need to sustain a move above $17.50 to confirm a return to medium-term demand dominance. Short-term, it is firming from the $16 area and a move below that level will be required to check potential for additional upside.
I took the constituents of the Gold Miners ETF (GDX) and tabulated the average realised price they get for gold, the margin they have from gold per ounce and the all-in sustaining cost of production. Unfortunately, not every company reports all three of these metrics but one common characteristic jumps out from the data. The vast majority are producing gold with a substantial margin of comfort.
The price could fall below $1000 before the majority would be unprofitable and yet this is an unloved sector of the global stock market. I can only surmise that very few people are interested in the sector because gold has been ranging for so long and they have therefore not been receiving the interest they deserve.
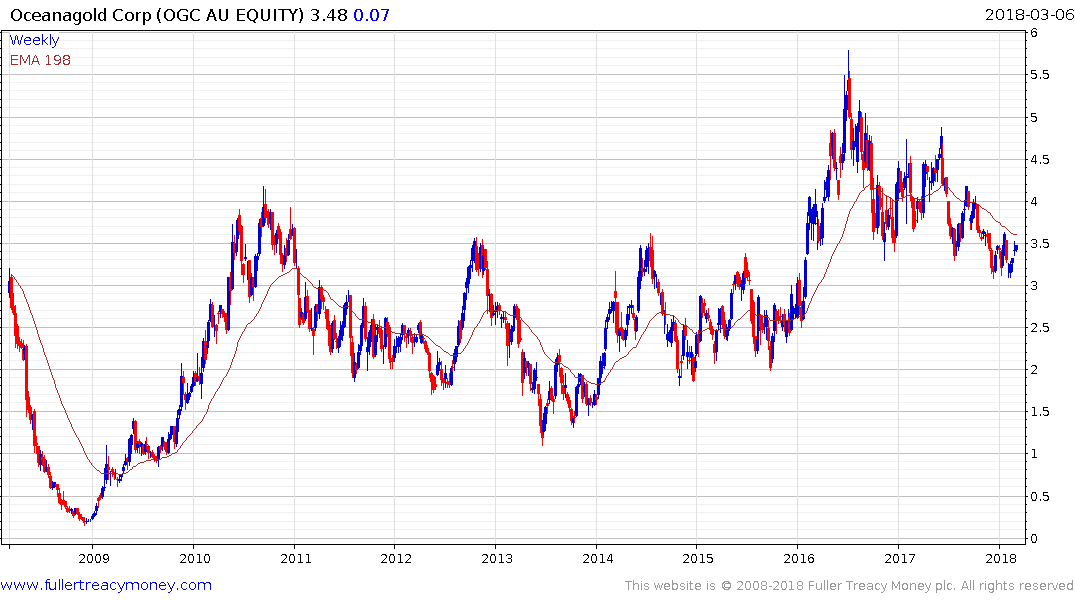
For example, Australian headquartered but Canada listed, Oceangold has a realised price of $1261, and a net margin of $914. The company’s all-in sustaining cost of production is $617. The share is currently bouncing from the C$3 area which represents the upper side of the underlying base formation and a sustained move below it would be required to question medium-term scope for continued upside.
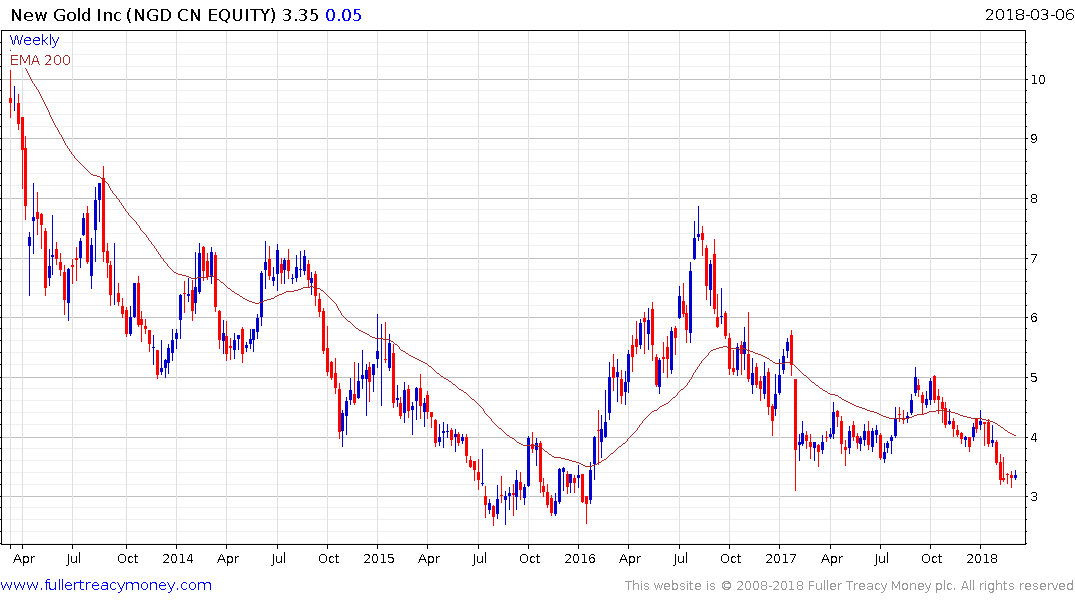
New Gold has been ahead of target in bringing its Rainy River project on line. The company has a book value of 0.72, realised price of $1278, cash margin of $875 and an all-in sustaining cost of $727. The share is back testing its early 2017 low and will need to hold the C$3.15 area if potential for at least a reversionary rally is to be given the benefit of the doubt.
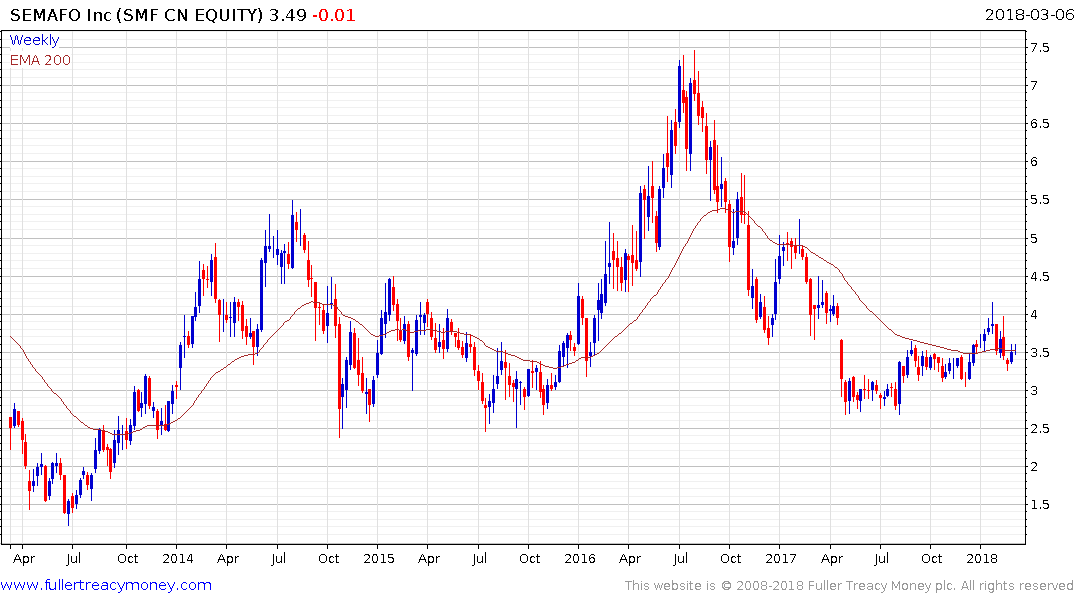
Semafo which is also listed in Canada, has a realised price of $1278, cash margin of $701 and an all-in sustaining cost of production of $720. The share has held a progression of higher reaction lows for the last year and is now firming from the region of the trend mean.
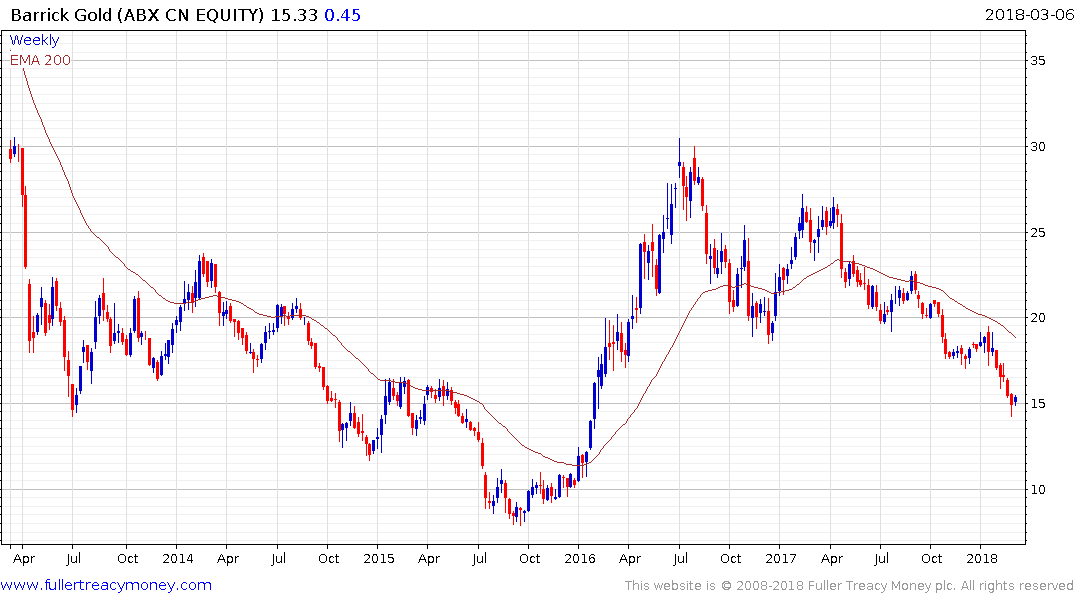
What became apparent after Barrick Gold reported in late February is investors are not yet willing to give mining company management teams the benefit of the doubt. Rather than laud them for achieving better all-in sustaining cost improvements, the focus of attention was on declining mine life.
However, it is exactly the investment in additional supply that resulted in the poor balance sheet performance of gold miners previously. The reticence of miners to engage in counter cyclical strategies is compounded by the fact that if a miner was to go to the market to borrow a great deal of capital to engage in expansion, when prices are low, they would pay a hefty premium for the perceived risk. The time when liquidity becomes available to them is when prices are already high. That contributes to the cyclicality of the mining sector.
Barrick Gold has a realised price of $1258, cash margin of $732 and an all-in cost of production of $750. The share remains in an almost two-year downtrend but is currently somewhat oversold relative to the trend mean so there is scope for a reversionary rally.
Back to top