
Flows vs. Fundamentals the upside risk to EM EPS
Thanks to subscriber for this report from Goldman Sachs which may be of interest. Here is a section:
The EM equity rally continued in July and August (+8%), albeit at a slower pace than the furious January-March rally (+20%), with MSCI EM sitting at 898 currently, or 2% off the cycle highs from two weeks ago. EM FX has corrected a bit more sharply in recent days, and our EM FX index currently sits just 0.5% above its March 31 close. Although sovereign credit spreads remain near cycle-tight levels, EM credit and local bonds have softened their rally as well in recent days (USD debt +4%, local debt +1% since end-June). As we discussed earlier this summer, an EM-friendly environment with equity being the strongest performer tends to occur during a ‘growth up, rates up’ phase of the cycle, and this has indeed been the macro backdrop (see EM Cross-Asset Strategy Part 1: Identifying ‘EM Risk’).
Much of the discussion surrounding the EM rally has focused on flows and positioning, but EM fundamentals have shown signs of a tepid improvement. EM GDP growth accelerated sequentially in the first quarter of 2016, and monthly data (such as Industrial Production) continued to improve in 2Q (see Exhibit 1). This is not the first time that EM growth has picked up since the global financial crisis – we have seen a few oscillations in sequential growth momentum and the bounce came off a low base in 4Q 2015. However, perhaps more importantly, the differential of EM vs. DM growth has improved in the past two quarters, a development we have not seen since early 2012 (see Exhibit 2).We have long argued that an improvement in the EM growth outlook is the essential ingredient in adopting a positive outlook on EM equity – both in absolute and relative terms. Consequently, while we are unsurprised that the EM rally coincided with improving growth earlier this year, we have remained sceptical on the rally for two mains reasons: (1) the GDP acceleration did not drive EM EPS higher, and (2) EM growth picked up off a very low base and amid a sharp rise in commodity prices (oil and metals) in late Q1 and Q2, something we do not expect to continue in 2H. Below, we discuss the upside risk

Here is a link to the full report.
Negative yields in some of the world’s largest developed markets has set off a global search for yield which has burnished the allure of many emerging markets. Meanwhile the rebound in commodity prices may have provided the bullish catalyst required to stoke interest in the asset class and is likely to remain a tailwind for the sector as long as prices are rallying.
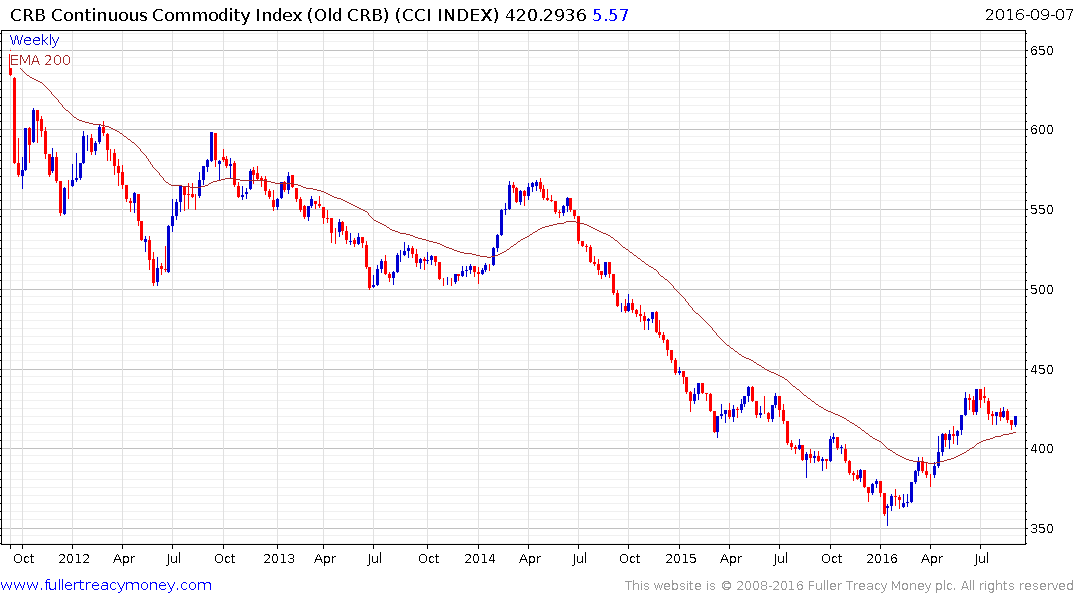
The Continuous Commodity Index almost halved in a five-year downtrend that bottomed in January. It hit a near-term peak in July following an impressive short covering rally and has been engaged in a process of mean reversion since. The Index bounced from the region of the trend mean this week and a sustained move below it would be required to question potential for additional upside.
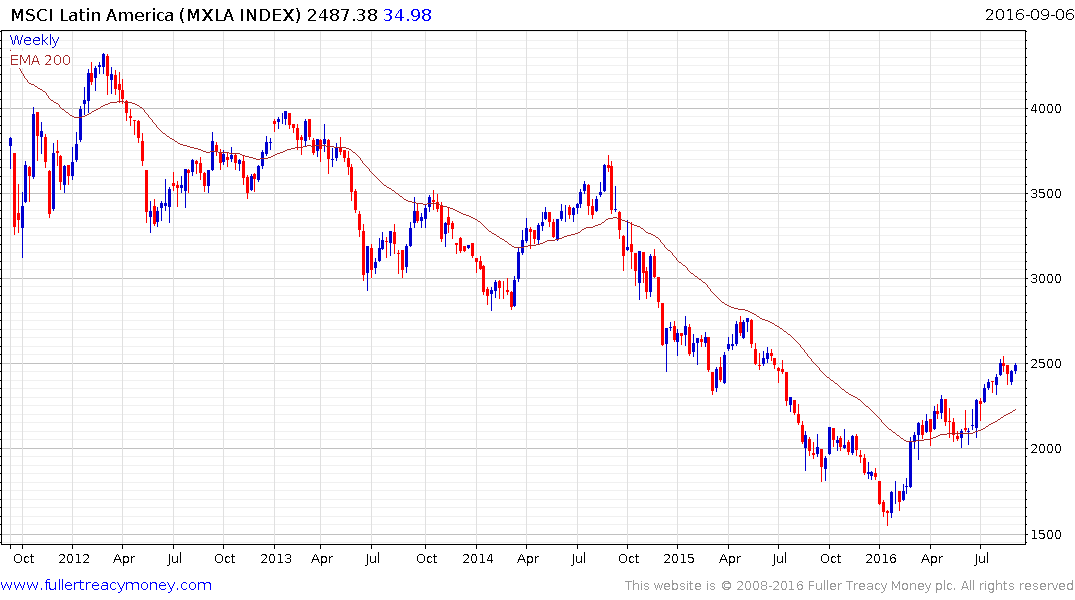
The MSCI Latin America Index is heavily influenced by commodity prices and shares a similar pattern to the Continuous Commodity Index.
The MSCI Emerging Index is heavily dominated by China, Brazil and Russia so it does not offer a particularly broad perspective of interest in emerging markets.
.png)
The Global X ASEAN 40 ETF broke out of an almost yearlong range in July and a sustained move below the trend mean would be required to question potential for additional upside.