
Email of the day on yield curve de-inversion and lack of demand for Treasuries
Eoin, you’re rightly highlighting the dangers of the steepening Yield Curve, or rather “uninversion” currently being undertaken. Typically though, this is a result of the Fed doing a U-Turn and cutting rates at the front end to soften the impact of a sluggish economy, or one in recession.
In this instance, it’s the other end of the curve showing the movement, only higher, as inflation continues to be a concern and the demand for longer term bonds isn’t enough to match the considerable supply. How does the change in dynamic to this “uninversion” influence your thinking?

Thank you for this topical question. I had a look at several past examples of when the 10-year – 3-month yield curve spread was inverted. The vast majority follow the process you describe at the beginning of your email.
Generally, the long-end pre-empts easing at the short end. In other words, the 10-year peaks before the 3-month. Then the 3-month collapses as interest rates are cut and the curve steepens into sharply positive territory.
.png)
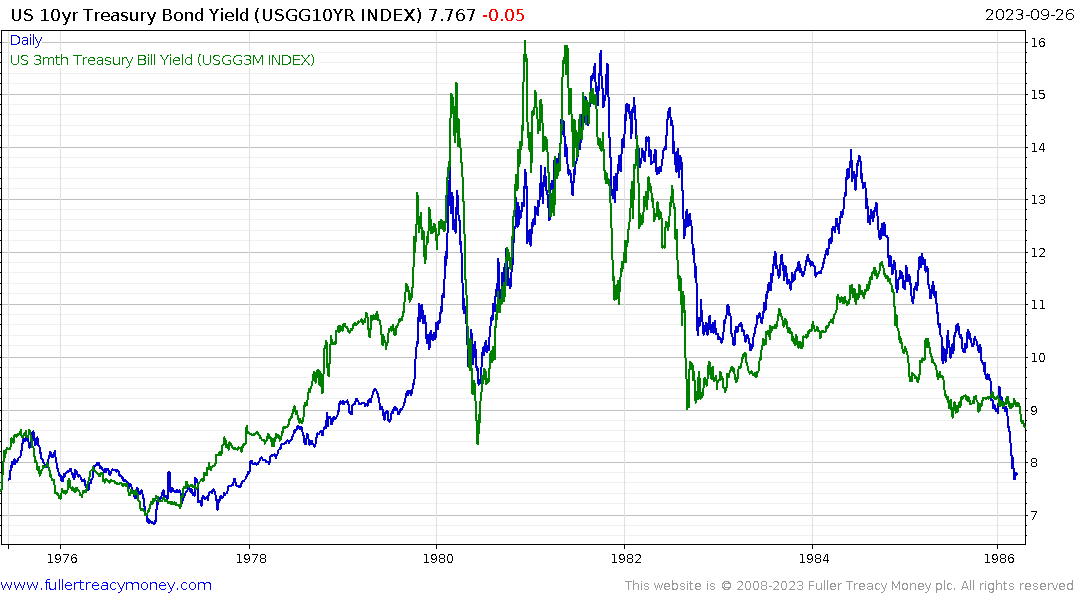
The only example where the 10-year continues to advance for longer than the 3-month was in the early 1980s. I don’t think it is a coincidence that the last time inflation was truly sticky was when the long-end of the curve represented a lack of faith in the security of US government debt.
.png) That was also a time when long-dated yields surprised on the upside. Many investors, myself included, have been burned by attempting to catch a falling knife in this Treasury market.
That was also a time when long-dated yields surprised on the upside. Many investors, myself included, have been burned by attempting to catch a falling knife in this Treasury market.
I hedged my long earlier this month because I believe Treasury yields will collapse when growth sputters and unemployment becomes problematic. With the first clear downward dynamic in yields I will close my hedge futures short and invest the proceeds in more TLT.
The inversion of the yield curve is a measure of whether monetary tightening has tightened enough to have an effect on the economy. It’s a graphic representation of Friedman’s “long and variable lag” in monetary policy.
For as long as it is contracting, stock markets perform well because the tightening is not yet evident. As soon as it turns upwards that represents when the risk of overtightening is increasing which is where we are right now.
The biggest stock market declines occur in response to the Fed cutting rates. The higher for longer mantra really means holding rates at elevated levels until unemployment rises. Then stagflation fears will become real and troubling simultaneously.
The reason the economy continues to expand while Treasuries are selling off aggressively is because growth is dependent on massive government deficits. That’s also why the core services ex housing measure has been so immune to monetary tightening.
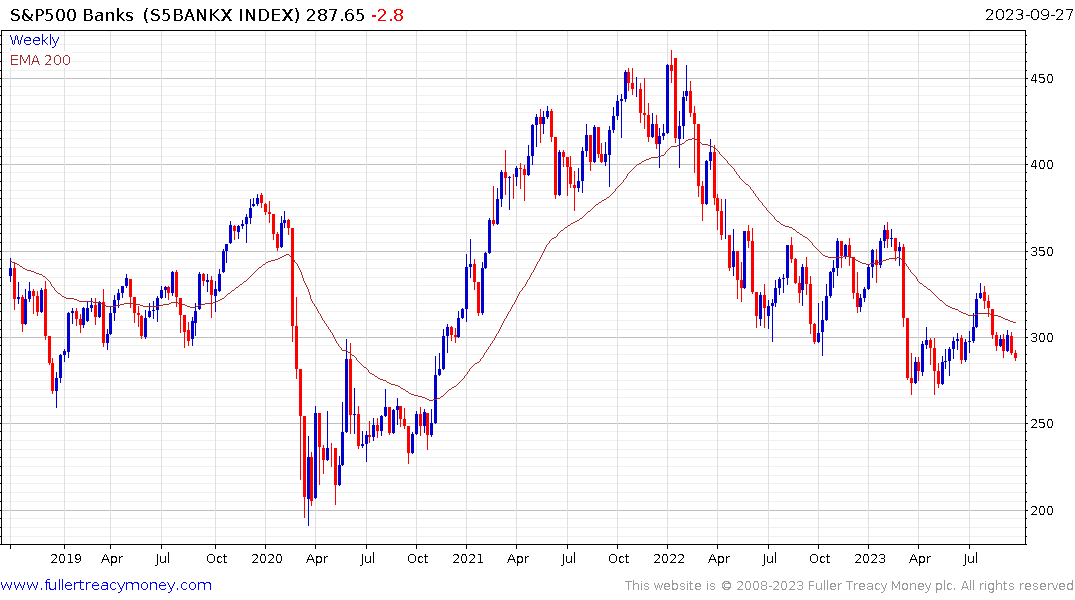
Quantitative tightening coupled with deficit spending means reserves are being siphoned out of the banking sector to create demand for Treasuries. That’s not only putting downward pressure on banking shares, but it impedes their ability to create new credit. The rise in Treasury yields is therefore accelerating the trend of tightening liquidity. That’s on top of the tightening from the inverted yield curve.
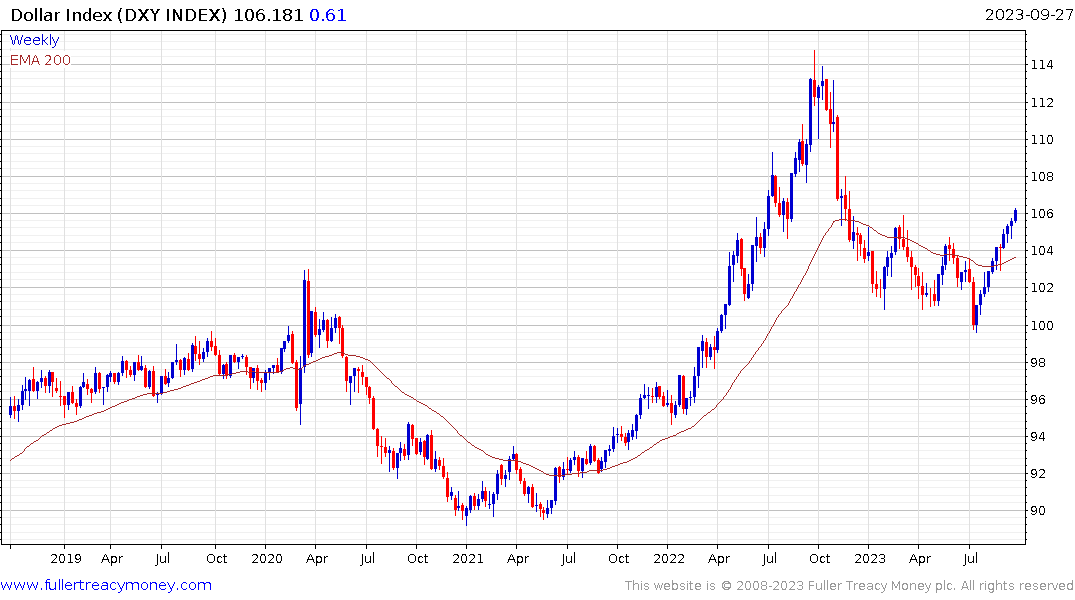 The continued strength in the Dollar is evidence of deleveraging and the rush to cash. It is only a matter of time before that is more fully reflected in stock prices.
 That Dollar strength is now exacting a toll on gold. The price broke below the psychological $1900 level today to extend the decline. I don’t expect Dollar strength to last but as long as it does it will act as a headwind for gold for as long as it does.
Money Market Funds Assets continue to accelerate higher. That represents fuel for an eventual rebound in Treasuries but not until rates begin to come back down.
Back to top