
Email of the day on the yield curve spread and Plato:
I tried to find in the chart library the last chart you should on Friday's Video. That is the difference between the US 10 & 2 year. This Friday's long term outlook was different but I liked it; even got myself a copy of Plato to read

Thank you for a question which may be of interest to subscribers. The yield curve spread is the difference between the 10-year and 2-year Treasury yield. I created this video to discuss both how to create the chart and save it as a preset template for when you want to find it later.
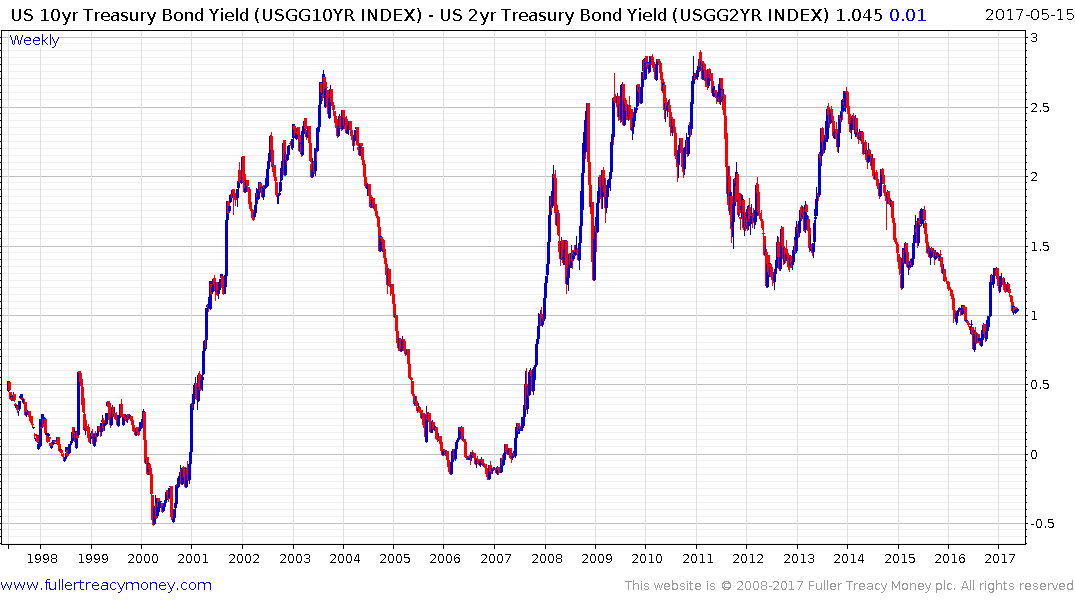
The spread has been contracting since 2010 when the monetary accommodation was about as loose as it has ever been. However, the contraction in the spread has been very slow which is a testament to just how long central banks have been supporting it. At 100 basis points conditions are tighter than they were in 2010 but the spread is still positive which is important for how we calculate when the next recession might be.
An inverted yield curve, i.e. When the spread goes negative, has a long history of predicting US recessions, often with up to an 18-month lag. That would suggest that if the pace of the spread’s contraction remains consistent it will be at least 2020 before we see the next recession.
I hope you enjoy the Republic it’s a true masterpiece and all the most interesting because it was written so long ago and yet has so much application to the world today. History doesn’t repeat but it certainly rhymes.
Back to top