
Email of the day on how best to utilise the trend mean (200-day MA)
Some recent research concludes,
“that the 200-day moving average — like most trend-following rules — is in reality little more than expensive disaster insurance. That doesn’t mean it’s worthless. But it comes at a price — in contrast to those who heretofore have claimed that you can both increase returns and reduce risk by following the indicator. “ and
“it’s possible — but unlikely — that NASDAQ stocks [having crossed the 200MA line]will continue going down a lot further than they have already.
The full report is here:
As an elderly novice on a steep learning curve, I have found it advisable to give due consideration to all the indicators, technical and fundamental. On this basis, it seems that, in the present circumstances, the NASDAQ 200MA may be a very useful indicator.

Thank you for a topical question and this is a subject I discuss at length in Crowd Money but let me summarise here. We define the 200-day MA as the trend mean. It’s is the average price traded over the last 200 sessions and is most useful when a consistent trend is evident. Another way to think about is that it is a mobile trend line and therefore of most use when a clearly defined trend is evident.
Overextensions relative to the mean generally suggest either prices are going to revert to the mean or will go sideways which allows the mean to catch up. In the course of a trend that can happen on a number of occasions and, because we are dealing with volatile crowds, prices can overshoot in both directions. Therefore while prices often find support in the region of the MA during trends, the level of the MA is not in any way sacrosanct.
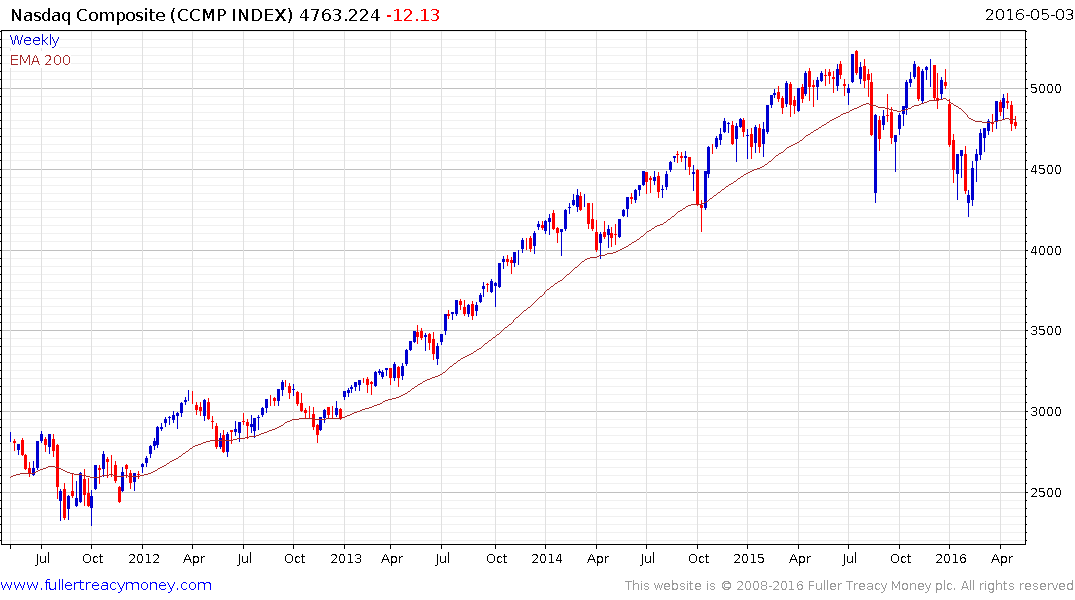
A range has been evident since July 2015 on the Nasdaq Composite Index. It has been both above and below the trend mean on a number of occasions. That simply confirms that a major loss of momentum is evident. This is quite different to the relationship between supply and demand that contributed to the consistently trending market, where the region of the MA offered support on a number of occasions, between 2012 and 2015.
The big signal that a change had occurred was in August last year when prices pulled back below the MA, in a dynamic fashion, for the first time in three years. What’s more relevant right now is that the Index has now posted a second lower high and fallen to break the short-term progression of higher reaction lows evident since January. The fact it is pulling back from the psychological 5000 level and the region of the year 2000 peak are also relevant considerations and I think more important than the moving average right now.
Taking all of the above considerations into account, technical damage has been done to the overall trend. Supply and demand have come back into balance and a sustained move above 5000 will be required to reassert the medium-term uptrend.