
Email of the day on missed opportunities, ETF volatility and stops?
What an extraordinary series of events this week! With retrospect I have to admit that David has been saying every day that there was a high probability of a correction of more than 10% before the end of October. And since these things usually occur during holidays, as you pointed out today, WHY did I not take the hint and play safe by just selling everything? I suppose for the same reason that David himself kept all his long-term holdings right through the 2008 crash. (At the time he said he would probably spend the rest of this career trying to find out why he hadn't sold.) I suppose we are all just inborn optimists.
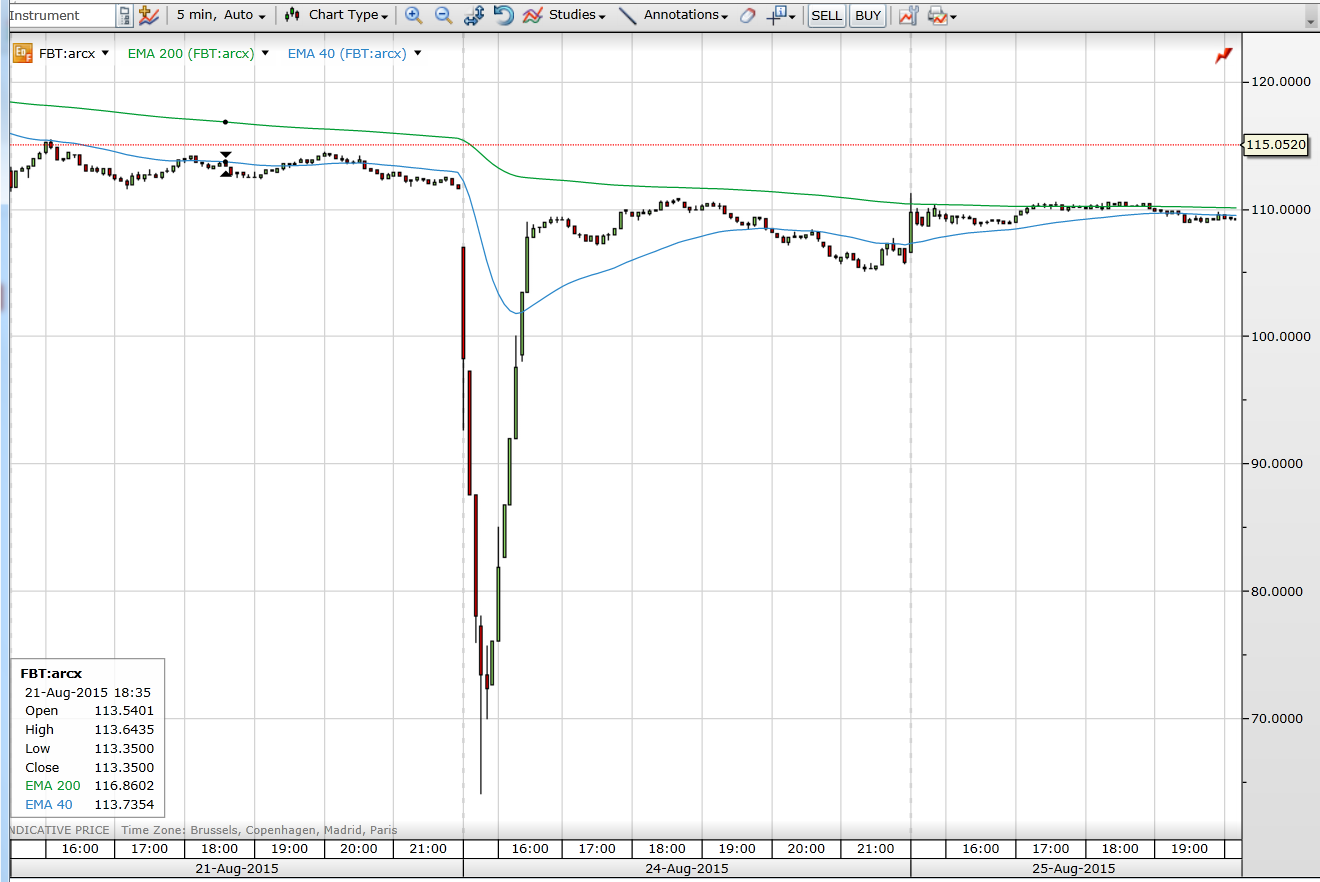
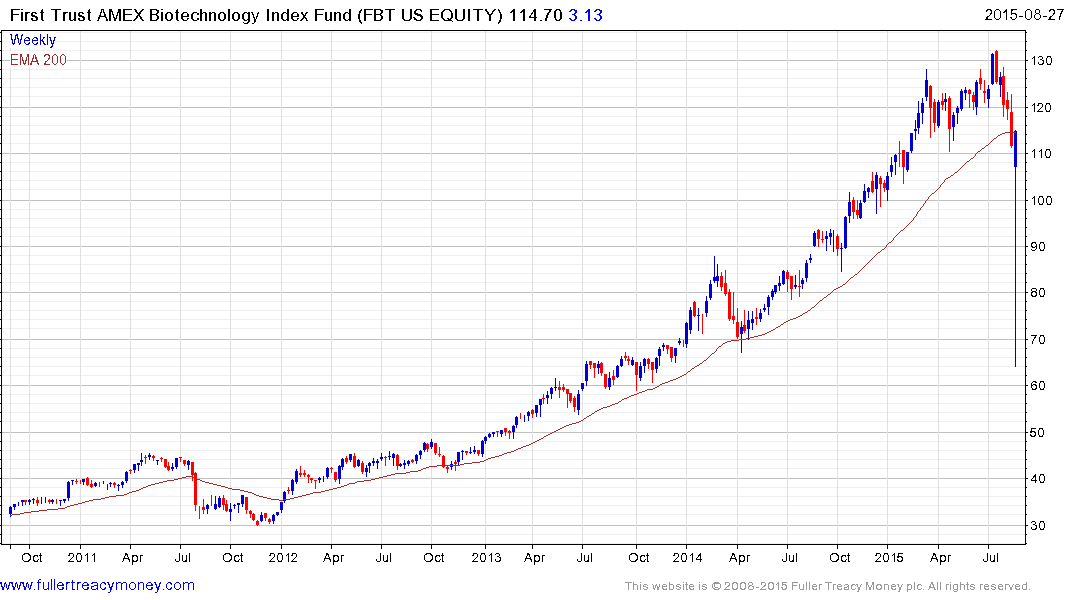
But there was another huge missed opportunity for most of us this week. Namely the flash crash on Monday morning. You have talked about single share volatility, but take a look at FBT, the biotech ETF. Even though it is an index with 30 components, none over 4%, it had a huge decline for about half an hour after the opening, going right down to 50% of its value at the recent peak. And right up again to Friday's level in the next half hour.
Now half an hour is a short time, but quite long enough for any wide awake person to realize what an opportunity he was being presented with! What stopped ME doing it was that I had buy orders at the bottom of the trading ranges for all the stocks I still needed to buy - which I realise now was not very sensible! Sell orders below the ranges would have been more appropriate. So by the time the crash came I had no money left for new purchases, unless I sold something that was still doing well. And who wants to do that?
To buy on those flash crashes also requires a firm conviction that the markets WILL recover, and sharply. And in that half hour it's difficult to make that decision.So what is my question? It is really to ask you to reflect more on how we could have used our knowledge (obtained by listening to you and David) of market mechanisms to profit from these moves. Or more relevantly, what we should look for next time and what would be an appropriate strategy.
Or would it be more useful to say that now the correction has occurred, nothing similar will happen for a long time, and now we should just buy and hold?
Regards and thanks for an ever illuminating service.
PS The times on the chart are CET, by which the market opened at 15:30.
PPS.I could draw two contradictory conclusions from these events. From the sudden correction, that stops are essential for all shares. And from the flash crash, that stops are just much too dangerous because of the danger of being whiplashed.

Thank you this illuminating email which eruditely encapsulates what I suspect a lot of people are feeling and thinking. I was short the S&P before going away for a few days last week but failed to reopen them when I got back home on Friday evening so I share your disappointment at missed opportunities.
I’ll be talking at UCLA tomorrow on Behavioural Technical Analysis and one of the topics I intend covering is on how much more difficult it is to sell than buy. How I think of this topic is in terms of a relationship and as the song goes “Breaking up is hard to do” particularly with investment positions where we have previously sat through corrective phases only to be rewarded
Let me answer your questions first, before moving on to some additional ruminations. When we express caution that there is a risk of a pullback, I would at least stop buying and introduce trailing stops on any positions that are accelerating higher. I’d look at my positions and assess what my portfolio would look like if the wider market pulled back by 10% and whether I would be happy to sit through that. If you are not putting stops on positions you need to at least think about what would have to happen to make you sell and what that will cost you in terms of missed paper profits. .
ETFs are now a dominant feature in the investment landscape but they have predictable issues with pricing, which we have written about previously, when the market is flooded with sell orders. The breakdown of BNY Mellon’s pricing engine exacerbated the problem during the panicky first two days of the week. I’m not sure this can be fixed if ETFs are to continue to be traded intraday. They will always have the problem of on occasion being more liquid than the underlying and at other times being less liquid.
The types of volatile intraday swings you point out in FBT were not limited to ETFs although ETFs certainly fell most. My fear is that this is not an isolated incident but rather symptomatic of the kind of market environment we find ourselves in where algorithmic traders and automated ETF platforms all draw the same conclusion at exactly the same time. These kids of events are not normal, as you conclude, they do not happen every day but they are becoming increasingly frequent and occurring in one market or another at least on an annual basis. If I am correct in that conclusion then the solution is to set aside at least a small portion of one’s investment capital for a ladder of long-dated, way out-of-the-money call options or warrants.
Let’s return to a discussion we have when we discuss stops at The Chart Seminar. When are people most likely to have stops? It’s generally following a large pullback because people fear an additional loss and perception of risk is high
People are less likely to have stops following a big advance because they are worried about being whipsawed. Emotionally, they are not ready to admit the potential loss of upside potential is often outweighed by the potential draw down. This is most relevant when a loss of momentum or other inconsistency is evident. Stops are a difficult topic because there is both an appropriate time and place to implement them but the subject is more art than science. This is why we put such stress on consistency characteristics in the discussion of stops.
When you have an inverted yield curve or oil prices are surging higher, then I think a stop is not only appropriate but necessary. Historically we do not have a precedent for the extraordinary monetary accommodation seen since 2008 but that doesn’t mean the eventual normalisation of rates will be hassle free or that the pain currently being experienced by emerging and commodity-led markets doesn’t have the potential to result in further volatility.
Therefore stops might have been appropriate before the decline but the level where one would put a stop today is sufficiently below where the market is trading that they are unfeasible. This raises the question of whether one should pre-emptively sell as the market gets back to the first area of potential resistance or please a tighter stop which would be financially based rather than rooted in the consistency of the chart. We might equally ask whether the position should be reduced to allow for how far away from the price a sensible stop would need to be placed. I suspect more than a few people are weighing these considerations right now. .
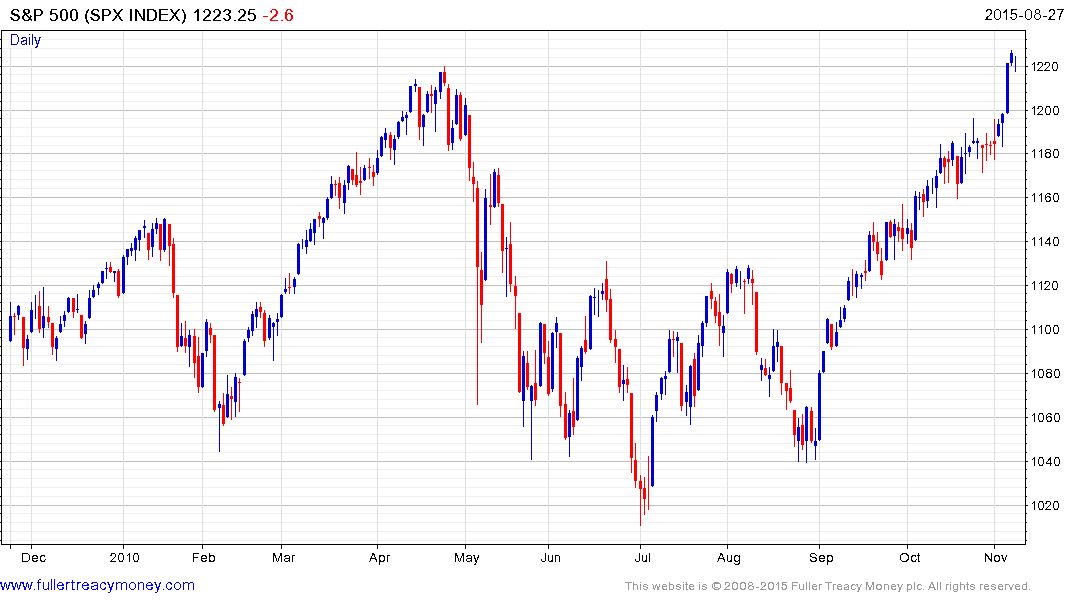
This chart of the S&P following the May 6th 2010 flash crash is potentially instructive. The big question following that event was whether it mattered and our answer was that since we were all still talking about it, it definitely had an impact on sentiment. The market rallied back to retrace almost the entire decline but the subsequent two months was characterised by a very choppy market that resulted in new short-term lows being posted. There is no evidence just yet that the S&P will follow a similar trajectory on this occasion but the first clear downward dynamic would probably result is some jittery market participants concluding discretion is the better part of valour.
.png)
As a result I think it is too early to sound the all clear. We could yet be presented with a more attractive buying opportunity. At least some support building will be required to demonstrate demand coming in at progressively higher levels and to confirm more than a short covering rally. The lower side of the overhead trading range represents the first area of potential resistance and what happens when it gets there will be very instructive.