
Dry Bulk Shipping BDI deconstruction & investment Implications
We occasionally receive inquiries relating to the Baltic Dry Index and this report from Deutsche Bank, kindly contributed by a subscriber in the interests of Empowerment Through Knowledge, is the best deconstruction of the index’s composition I’ve seen. Here is a section:
There are two main reasons why Capesize T/C rates have been more volatile historically and therefore contributed more to the BDI’s movement than the other three vessel categories, in our view.
Firstly, over the past few years, deliveries of dry bulk vessels have concentrated largely on Capesize, and hence the supply side has displayed a stronger volatility in Capesize than other categories.
Secondly, there are fewer varieties of cargo being carried on Capesize vessels than on smaller vessels (Figure 5). According to industry participants, more than 70% of the cargo being carried by Capesize vessels is iron ore, with the rest coming mainly from coal and, to a much lesser extent, grains.
In terms of T/C rates, the C9 route has been far more volatile than the other three routes. C9 itself explains 44% of the overall movement in the Capesize category, followed by C8 and C10 (both 28%). As C11 is related largely to the repositioning of empty vessels from the Far East to Europe, this route has little impact on the overall volatility of the Capesize category.
?As the C9 route travels from continental Europe/the Mediterranean to the Fast East, the major cargo involved is largely Brazilian iron ore to the Fast East. As most of the iron ore cargo is discharged in the Far East, vessels need to be deployed from the Pacific Basin to the Atlantic Basin when Brazilian iron ore shipments pop up. The time lag, together with the longer distance, probably explains why the T/C rate for the C9 has had a higher volatility historically than the other three routes. Figure 8 lists the possible routes/cargos for each Capesize route. Figure 9 shows the major sailing routes.

Here is a link to the full report.
The surge in demand for iron-ore in Asia encouraged shipping companies to increase their fleet sizes to cater the higher volumes. However, the demand growth expectations on which these bullish projections were based have proved over ambitious in the aftermath of the credit crisis. The net result is that shipping prices have declined.
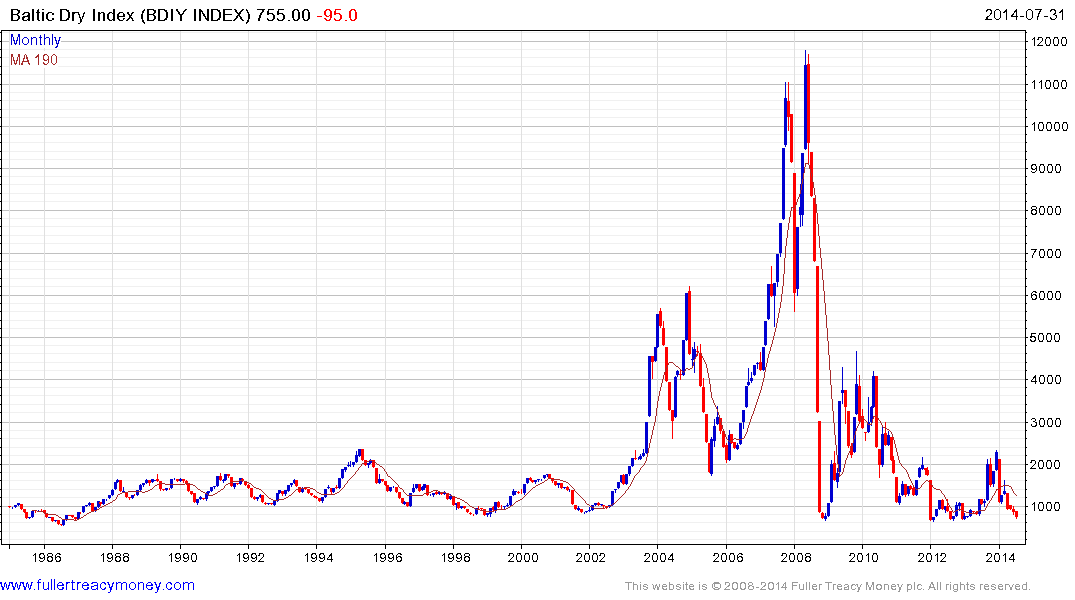
Over the course of the last 30 years, the Baltic Dry Index has tested the 700 area on a number of occasions but has not traded below it. It has returned to retest that level over the last seven months and the first clear upward dynamic will likely signal a low of at least near-term significance.
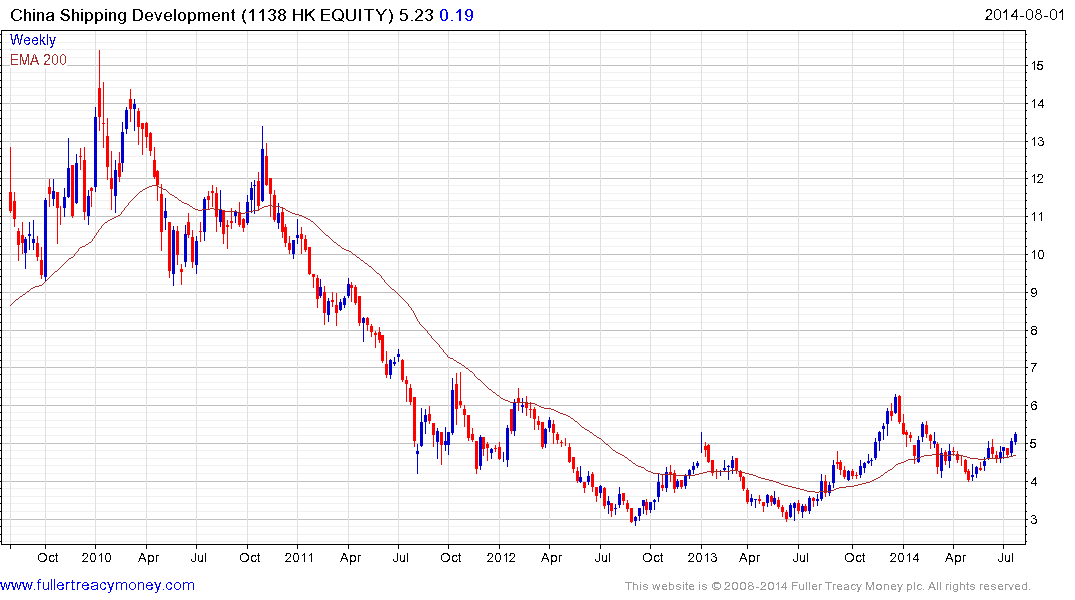
China Shipping Development is trading back above its 200-day MA for the first time since 2010 and a sustained move below HK$4.50 would be required to question medium-term scope for continued upside.
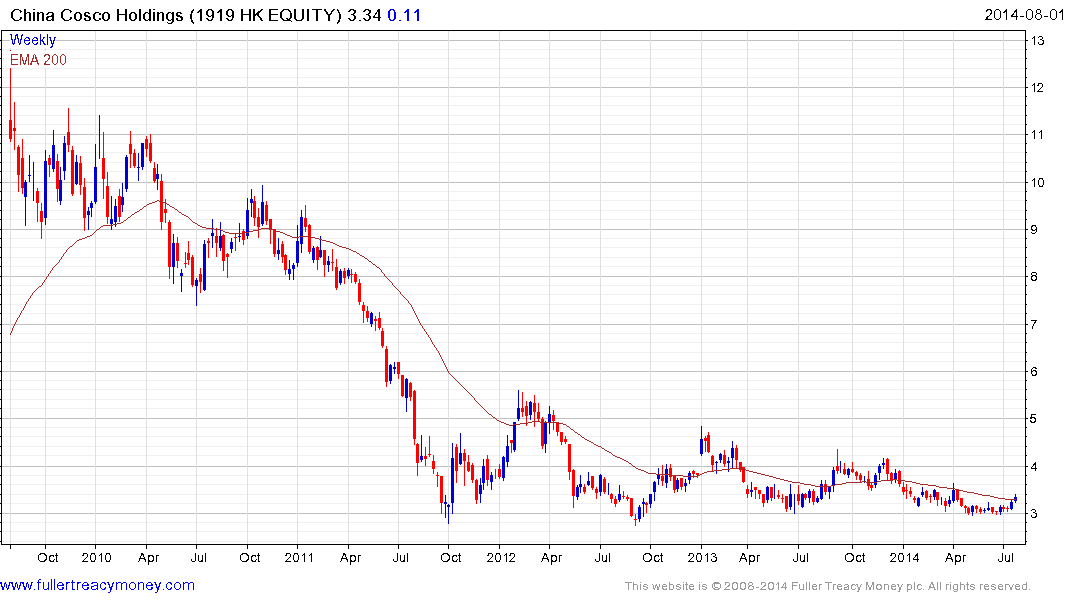
China Cosco Holdings is firming from the lower side of an almost three-year base.
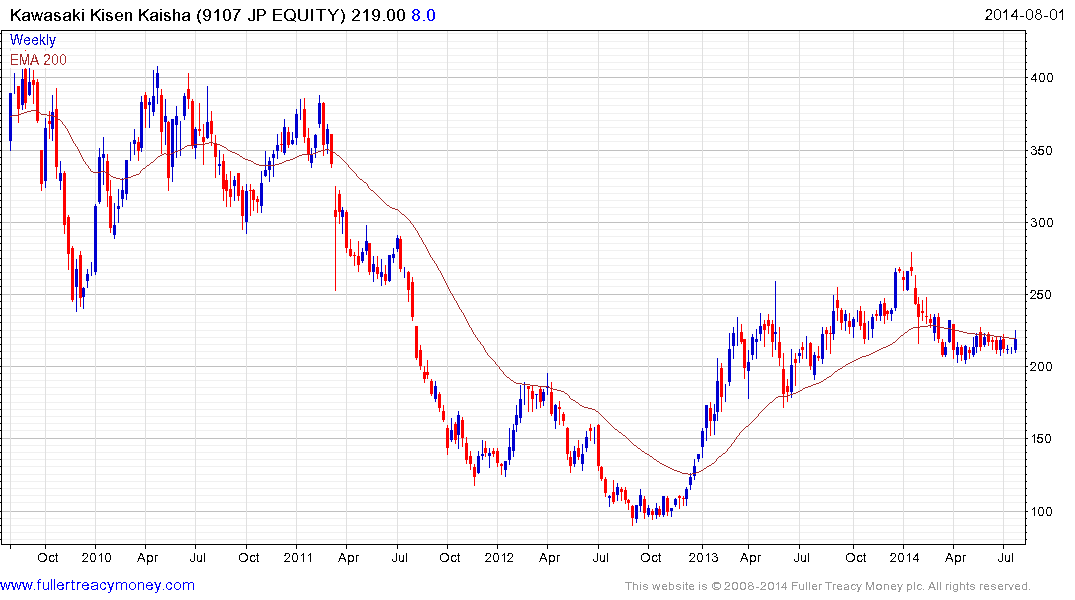
Kawasaki Kisen Kaisha continues to form a first step above its base and is currently firming from the lower side near ¥200.