
Breakfast with Dave
Thanks to a subscriber for David Rosenberg’s report for Gluskin Sheff dated yesterday. Here is a section:
The Fed seems to have rose-colored glasses on regarding this experiment ahead in terms of even gradually unwinding the balance sheet and the impact on the same financial markets that are deemed at least those around the table (presumably the one with Bloomberg terminal) to be excessively exuberant. And at the same time, the view on the economic outlook seems quite rosy, then again, the central bank has overestimated economic growth consistently for the past seven years. Old habits die hard.
But there are some at the Fed that share our views on many items. Here were a few new wrinkles:
“Contacts at some large firms indicated that they had curtailed their capital spending, in part because of uncertainty about changes in fiscal and other government policies…”Reports regarding housing construction from District contacts were mixed.”
District contacts reported that automobile sales had slowed recently; some contacts expected sales to slow further, while others believed that sales were leveling out”
So here we have soft capex, soft housing and soft autos. But yet the consensus view is that the economy is doing just fine. A case of cognitive dissonance?

Here is a link to the full report.
You have Ray Dalio saying, keeping dancing but stay close to the door, regarding the equity market. Jeff Gundlach says the run-up in yields is only beginning. David Rosenberg says deflation is here to stay. The problem for investors is that they all make cogent arguments and it is difficult to divine just where we are and what is likely to happen next. Let’s just stick to the charts.
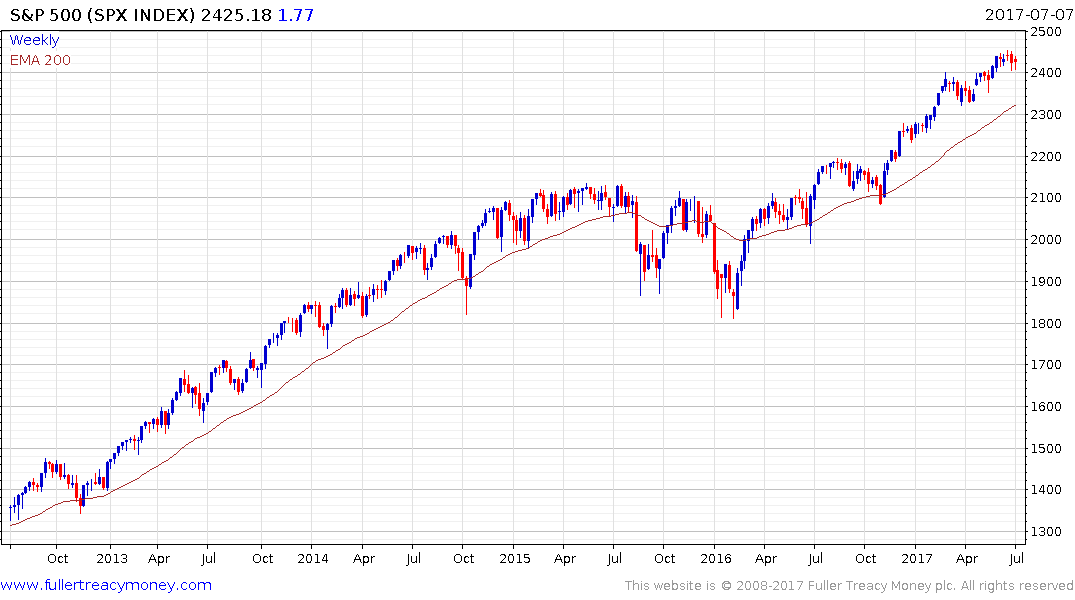
The S&P500 hit a peak on June 19th just above 2450. It has been trending consistently higher since early 2016 but, following the Presidential Election, reactions have been limited to about 50 points. This has delivered a succession of ranges one above another. To begin to signal a change to the rhythm of how this Index is trending it would at least need to react by more than 60 points and more importantly sustain a move below the trend mean.
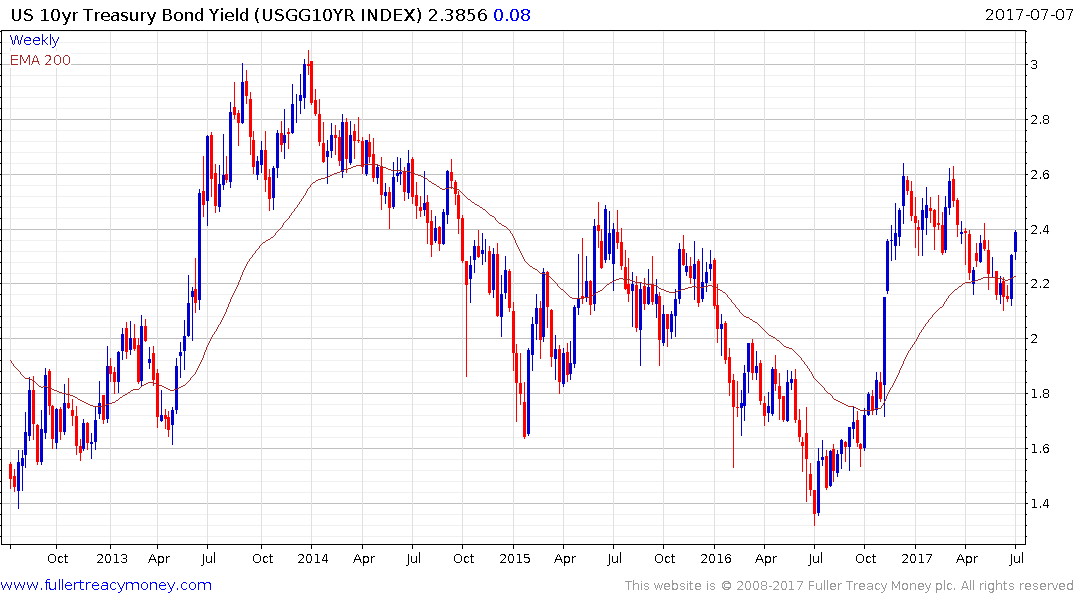
US Treasury yields experienced a considerable run-up from mid-2016 but paused near 2.6% from December. There has been a clear progression of lower rally highs so far this year, which resulted in an orderly reversion back towards the mean. The rate is now testing the sequence of lower highs and a sustained move above 2.4% would signal a return to more than temporary supply dominance.
There is also some evidence of rotation in the stock market and the yield curve is flattening. The fact central banks are turning more hawkish and beginning to anticipate an uptick in inflation against a background where this is a lot of leverage already in the system suggests this is not a risk-free environment. However, what the charts tell us is that we have not yet reached a tipping point where there would be evidence of top formation completion. The return to performance of cyclicals like basic resources and banks suggests we are in the latter stages of this expansion, but that is also when acceleration is more likely so this is an important time to monitor trend consistency.