
The Economy Is Getting Harder to Forecast
This article by Gary Shilling for Bloomberg may be of interest to subscribers. Here is a section:
Disinflation has reigned since 1980, but real interest rates were positive until the last decade. But for 10 years now, real 10-year Treasury note yields have been flat at zero (see my Nov. 19, 2018 column, “Zero Real Yields Are Tripping Up Investors”). This and the flat yield curve have pushed state pension funds and other investors far out on the risk curve in search of real returns, bidding up stocks to vulnerable levels.
Earlier, the Fed was run by Ph.D. economists who clung to widely-held theories even though they didn’t work. Fed Chairman Jerome Powell is proving to be much more practical, backing away from rigid Fed policies such as the 2% inflation target and a zero-bound policy rate as well as unsuccessful forward guidance.
In this different economic climate, it’s hard to time the end of the current recovery. Still, it will end, due either to Fed overtightening or a financial crisis, like the 2000 dot-com blow-off or the 2007-2009 subprime mortgage collapse. In the current excess supply-savings glut-deflationary world, it’s likely a recession will unfold due to a shock before the Fed overtightens.

The distortions quantitative easing and other extraordinary monetary measures have created will be debated for decades. There is no arguing with the fact that relationships between asset classes which were reliable lead indicators in the past are less relevant in an environment where central banks are manipulating the yield curve. However, we need to remember that bull markets thrive on liquidity and price charts tell us what people are doing with their money.
The big question a year ago was where are the new sources of liquidity going to come from to support the bull market. The Fed was reducing the size of its balance sheet and raising interest rates, the ECB’s QE program had ended and China was reluctant to stimulate. As a result, the total assets of the major central banks contracted by $1.5 trillion in the 2nd half of 2018. Today central bank assets are expanding once more and the total has risen by $700 billion since September.
.png)
A consistent trend is a trend in motion. As long as Wall Street continues to hold its move above the 200-day MA, we can give the benefit of the doubt to the upside.
I found these two graphics to be of particular interest because they highlight where the excesses are evident in this bull market.
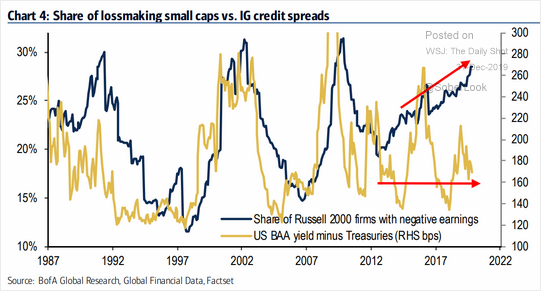
It stands to reason that when the number of loss-making small caps rises it should put upward pressure on bond spreads. That has been the historical relationship but it is not holding true today.
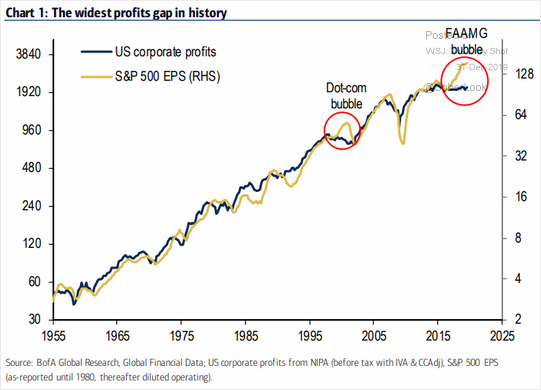
The second is the fact EPS has been spurred by the outperformance of mega-caps and the trend of buybacks by the same cohort of companies. Meanwhile corporate profits have been stagnant for the last five years. That suggests a concentration of returns in a very small number of issues.
Arguably both of these disparities are late cycle phenomena but are also supported by the liquidity fuelled environment. Therefore, price charts and the trend of global liquidity are the most important things to monitor for a reading on the health of the bull market.
Back to top