
Stupid 'Rich' Skew in Apple, Greed Breaks Things
This article from the BearTrapsReport may be of interest to subscribers. Here is a section:
Jan $180 Strike Calls costs $4
Jan $80 Strike Puts costs $1*Both options are $50 out of the money, approx data, BUT it is nearly 3x more expensive to buy upside risk in AAPL equity. Downside protection normally costs more than upside risk participation, NOT today. What does this mean? One large buyer has made a colossal splash in the market and the scent of greed has drawn thousands of other market participants into the dangerous game. Several clients in our institutional chat on Bloomberg have cited SoftBank as the original size buyer. We have NO IDEA if this is true, just that highly credible clients have made this reference several times over the last week. It’s a high-stakes game of musical chairs, the ultimate greater fool theory moment. The colossal call buyer has thrown meat in the water and drawn in the sharks, but unfortunately thousands of Robinhood minnows at the same time. When the large players’ exit, the little guy and gal will be left holding the bag.
Apple closed near $130, while the cost of speculative upside calls is weighted heavily against the buyer. Someone must have reached out to Buffett today because he can make a fortune in selling $AAPL upside calls.

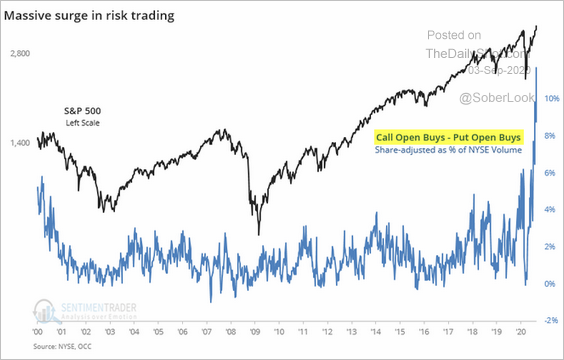
Options volume has spiked higher over the last few months to hit multi-year highs. Options offer significant leverage to both the upside the downside and are among the primary vehicles for traders to take on outsized positions relative to their capital. The significant rebound in stay-at-home shares has resulted in an impressive momentum move which is not taking at least a breather.
The CBOE’s Put/Call ratio is at a 10-year extreme which is a clear reflection of the speculative interest in a relatively small number of shares over the last month. That suggests the risk of at least some consolidation has increased substantially.
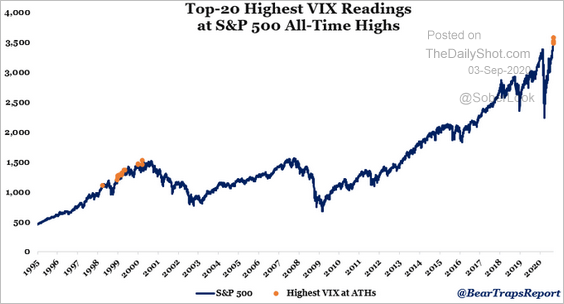
This chart from the above article is particularly interesting in my view. It depicts the times when the VIX has made a new recovery high at all time peaks for the S&P500.
The only time this has happened before was in the period between 1998 and 2000. Back then the Asian Financial Crisis, Russia debt default and collapse of Long Term Capital Management conspired to hold down interest rates. That lent fuel to the speculative mania that emerging in the technology, telecoms and media sector. The time pressure of Y2K frontloaded demand and pulled sales forward from years in the future.
Today, the pandemic has depressed rates to zero, the Fed has told us they are going to stay low for a long time. That’s a global phenomenon. It’s represented a clear acceleration of the trend of central bank balance sheet expansion and rising government fiscal deficits.
The bull market up from the lows in 2008 has been liquidity fuelled and this is an intensification of that trend. The pandemic has also represented a time pressured catalyst because it has forced everyone to transition immediately to remote work and learning. That’s a front-loaded hardware and software-as-a-service (SaaS) purchases into this year.
There is no doubt very overbought conditions in the tech sector are at risk of being unwound. Rising interest rate killed off the bubble in 2000. However, stocks today are a lot more interest rate sensitive than they were twenty years ago because rates are so much lower and debt is higher. Even a whiff of higher rates would represent a significant challenge to upside potential. That is not looking likely in the near-term but tech represents such a large weighting in indices that ETF flows tend to move to the whole market.
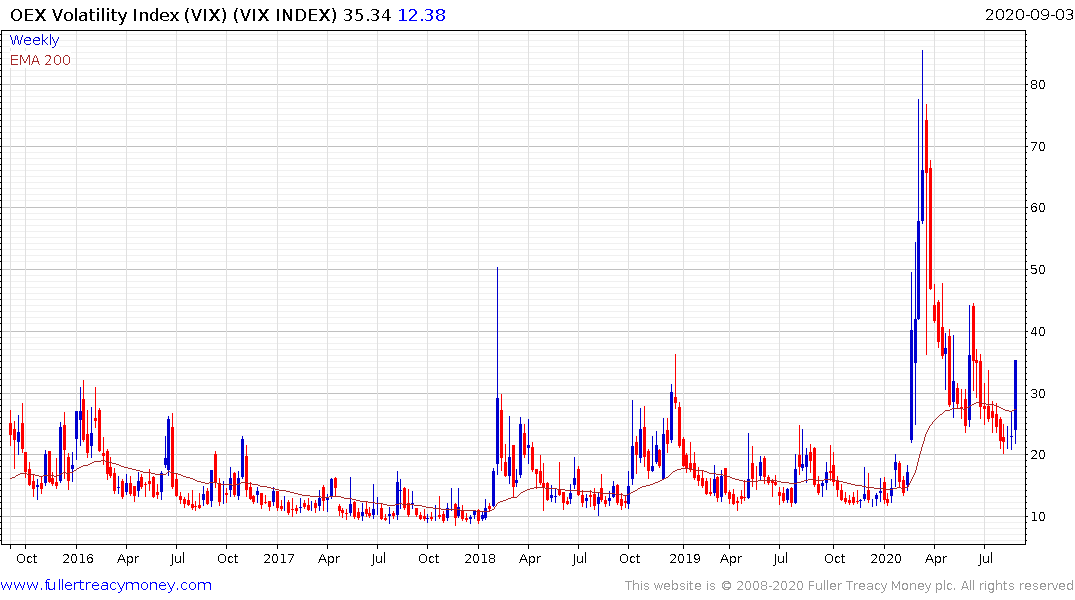
The jump in the VIX today will force systemic traders to automatically reduce exposure. A clear downward dynamic would have the opposite effect.
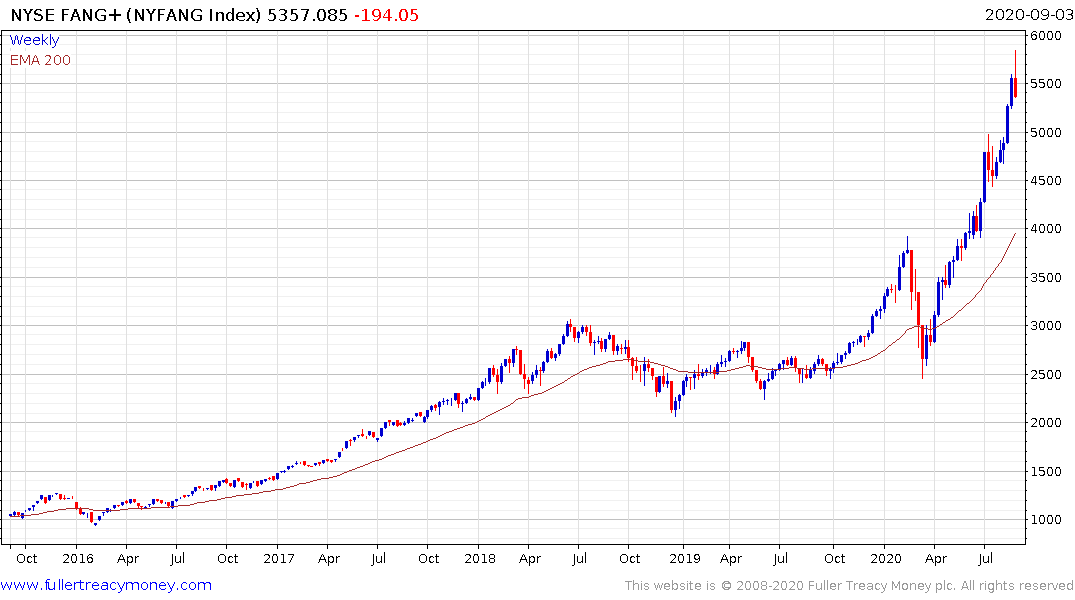
The NYSE FANG+ Index posted its largest downward dynamic in months today. That signals a peak of at least near-term significance. Reactions during the run-up from the March low has been limited to 500 points. If the trend it to remain reasonably consistent it will need to find support soon.