
Solar Cycle Science
The subject of solar minimums is starting to arise once more in popular media and this site, from a former NASA scientist, contains all of the relevant information. Here is a section:
In the 1800s astronomers realized that the appearance of sunspots was cyclic, with a period averaging about 11 years. As new features of the Sun (solar flares, filaments, prominences, coronal loops and coronal mass ejections) were discovered, it was found that they too varied along with the frequency of sunspots. The sunspot number is now commonly accepted as a measure of solar activity. Solar activity itself has been linked to satellite failures, electrical power outages, and variations in Earth’s climate. The impact of solar activity on Earth and our technology has created a need for a better understanding of, and the ability to predict, solar activity.
Sunspot activity over the last four hundred years has shown that the amplitude of the sunspot cycle varies from one cycle to the next. The average cycle has a peak sunspot number of about 150. At times, as in the period known as the Maunder Minimum between 1645 and 1715, solar activity can become so weak that it seems to disappear for several decades at a time.

The Maunder Minimum persisted for about 50 years between 1650 and 1700 but rigorous recording of sunspot activity did not really start until 1750. I see a lot of misreporting of data by lobby groups arguing both for and against anthropomorphic climate change with each bending the data to fit their own narrative. I did some cycle analysis of solar cycles a decade ago predicted the lower high of the current cycle so I thought would refresh that now.
It is logical, at least to me, that the big ball of exploding gas in the sky has an effect on climate. Sunspots do not provide us with an especially consistent pattern but let’s identify what the consistency characteristics are. There is about 11 years between the individual peaks in activity. The big question is whether there is a longer-term pattern to the activity?
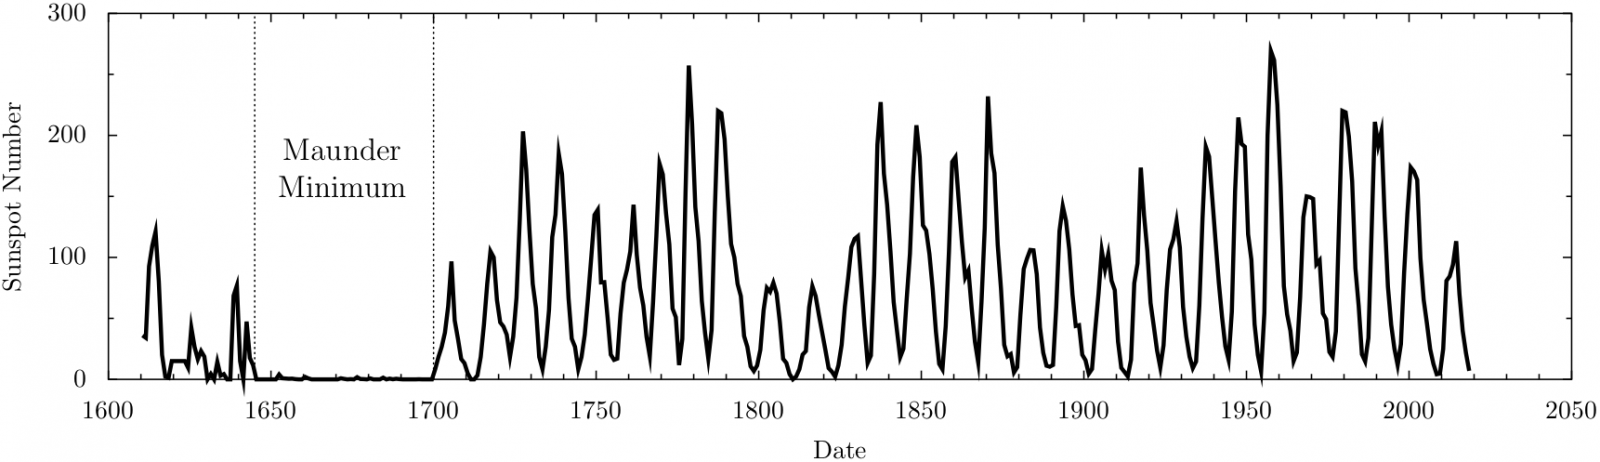
This long-term chart suggests there is. About every 100 years there are at least three cycles that are less intense that the rest. That suggests the sun goes through long-term cycles of intense periods of activity followed by shorter periods of less intense activity. That suggests the next upward cycle which should begin next year will eventually peak at a level similar to the 2012 peak but not higher than the 2001 peak.
Anyone thinking about a refresh of the Maunder Minimum likely has to wait about 22 years for the next two cycles to play out. After that, we would expect solar activity to intensify again based on the cycle of the last 300 years. If that fails to happen then we could begin to anticipate a prolonged period of inactivity.
However, it is worth pointing out that the severe winter weather and spring storms in the USA have coincided both with a solar minimum and an El Nino.
Back to top