
Saut Strategy July 15th 2019
Thanks to a subscriber for this report by Jeffrey Saut. It focuses on a defence of monitoring charts which may be of interest. Here is a section:

Here is a link to the full report and here is a section from it:
I entered this business in 1971 on a trading desk in New York city. Since then I have been a trade desk manager, a retail stock broker, branch manager, analyst, portfolio manager, Director of Research at five different firms, and head of Capital Markets at three firms. As such, I used to do reviews on the analysts. One of the questions I asked those analysts in said review was, “Do you look at the charts of the companies you have in your research coverage?” I would say over 50% of them would say no. “Why not,” I would reply. Their answers were far ranging, but the gist of their message was they think that charts are tantamount to voodoo. If that is true, then why do 95% of the portfolio managers (PMs) you call on pull up a chart of the stock you are pitching to them? To that statement there was generally no response, so I will tell you why. It is because that is the world they live in. The PMs are looking at the charts because they are trying to determine if what the analyst is telling them is being reflected in the price of the company. Indeed, when you can be measured to the second decimal point every morning it becomes an extremely humbling business!
Over my nearly 49 years in this business there has been a running battle between fundamental analysts and technical analysts. However, my father used to say, “Son, you need to use both charts and fundamentals. It’s like words and music.” As our colleague Andrew Adams wrote in his insightful Charts of the Week report last Wednesday:
“Modern technical analysis encompasses enough information to fill ‘door stopper-sized’ textbooks (just go check out Amazon for proof). The discipline has expanded considerably over the last several decades to include hundreds of different methods, indicators, and chart patterns, as well as aspects of related fields such as intermarket analysis, behavioral finance, and statistics. Yet, the field’s origins go back at least to the 17th and 18th centuries when Dutch and Japanese traders/merchants would use basic charting techniques to keep track of prices. It was an easier way to visualize the data through time and helped practitioners in their dealings back when markets weren’t nearly as efficient or ‘observable’ as they are today. I mention this history because given all the sophisticated tools at our disposal here in 2019, it can be very easy to veer too far away from the traditional spirit of price charting. At the end of the day, we’re just trying to figure out if something is more likely to go up or more likely to go down, and it is more of an art than a science (yes, it’s an overused cliché but that doesn’t mean it’s not true). In short, the goal is to try to keep the probabilities in our favor as best we can using the past and our limited understanding of human nature as a guide.”
The charts tell us everything people have already done with their money and they offer the clearest reality check on our personal theories for market action. The simple fact is that if our view of the market is not supported by the price action then we need to change it.
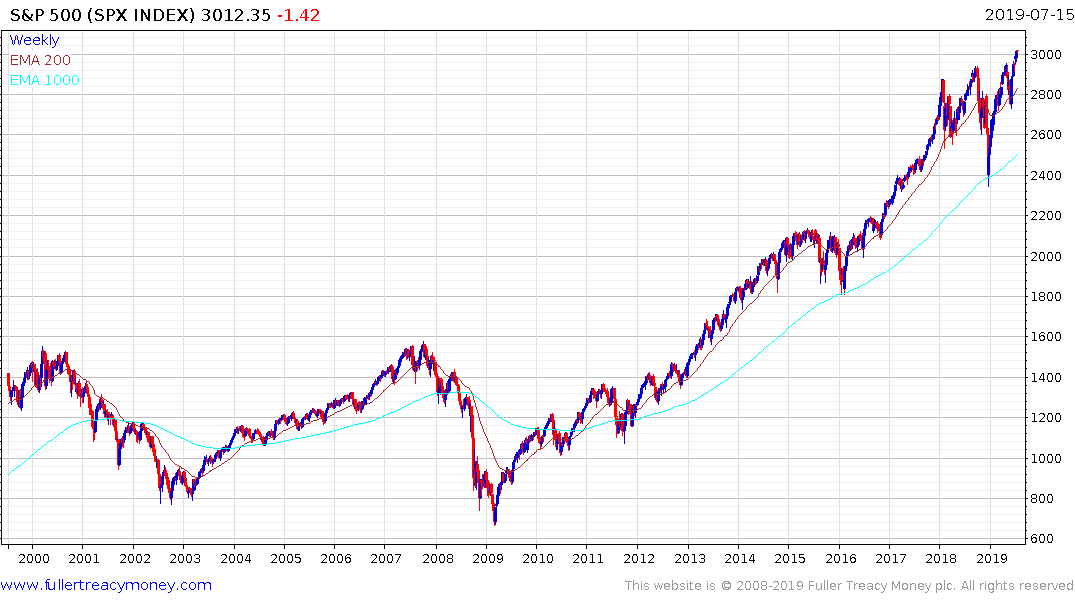
In the course of the uptrend from 2009, there have been three major consolidations each lasting about 18 months. Each of these medium-term tern corrections found support in the region of the 1000-day moving average. With the breakouts seen last week it is looking more likely than not the secular bull market is about to embark on another up-leg. This happens to coincide almost exactly with what we expect from the second half of the 3rd year of the US Presidential Cycle.
20% pullbacks, like we saw in the 4th quarter are nothing to sneeze at and we have to be alert to reversionary risk when wide overextensions relative to shorter-term trend means, like the 200-day MA, are evident. At the very least that tells us it is an inopportune time to buy and the best course of action may to be to lighten up. However, this has all the trappings of a secular bull market and a sustained move below the 1000-day MA would be required to question that view.
Back to top