Email of the day - on tops versus medium-term corrections
Dear Eoin, I hope you are keeping well. A very (very) general query, but I've found myself struggling to distinguish between mean reversion in ongoing trends and type 2 / type 3 trend endings. Can we overlay some (subjective) fundamental analysis to gain some clues at this point, or do we have to "wait for the charts to show us"? Or is it about trend consistency? I accept the uncertainty present in markets and that one man's mean reversion is another man's top / bottom, but as this has been playing on my mind, I thought I'd ask the question. Please feel free to answer this in the context of examples as they come up if that's easier! Sincere thanks for the unique and invaluable service.
Distinguishing A top from THE top is a big question and requires us to have an appreciation for what the motivating factor behind a move is. The most pressing point is that every secular bull market is punctuated by several medium-term corrections. Market trends are endlessly fractal so we see evidence of acceleration, massive reactions against the trend and massive congestions areas on occasion.
The differentiating point is the condition of the broader monetary and fiscal environment. In simple terms, when there is less money in the system, it’s harder to sustain trends. The reason everyone worries about recessions is the stock market usually peaks ahead of a contraction.
I keep an eye on credit conditions for the broader market so the yield curve spread, high yield spreads, equity issuance, central bank balance sheets and banks all give clues to where we are in the broad market cycle. All of these measures are still very favourable to asset price appreciation at present.
A significant rotation has been underway for the last few months which has resulted in a great deal of internal movement inside the major US indices but an uninterrupted uptrend overall. This bull market has been liquidity driven since 2008 and it remains supported by massive provision of liquidity. Until that changes, reactions are likely to be limited to reversions to the mean.
The biggest thing anyone should be concerned with today is what bottoming characteristics look like. Large numbers of international indices are breaking out of long-term ranges. That’s generally consistent with base formation completion and the beginning of new bull markets. Gold miners completed a base formation a year ago and have been forming a first step above the base since. That’s also supportive of a new bull market hypothesis.

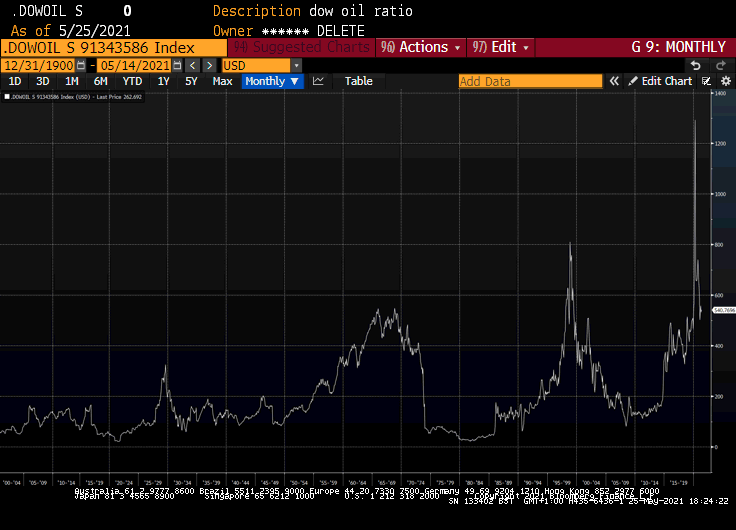
The long-term pattern of performance between the Dow and Oil suggests that whenever we see an accelerated peak, commodities outperform over the next decade. That’s something to bear in mind as commodities break higher even as stocks are still in an uptrend.


