
Email of the day - on volume data
I hope you and the family are enjoying a normal coronavirus free lifestyle?
I was looking at some 2 year charts recently, and I know you are not always fan, but I noticed quite large volumes spikes on some individual co charts, but especially on the DJ and the NASDAQ. Near the end of 2018 and again last week major volume spikes. My experience over the last 50 years has taught me though it's not 100 0/0 accurate, volume spikes can be a very useful tool for gauging tops and bottoms, more so for lows. I just thought subscribers might find this food for thought!!

Thank you for your concern. I’ve got some travel coming up over the weekend which I am not especially thrilled about but it falls into the necessary category. I intend to take a number of infection prevention measures while travelling. Other than that, it has been business as usual since we have stocked up on just about everything.
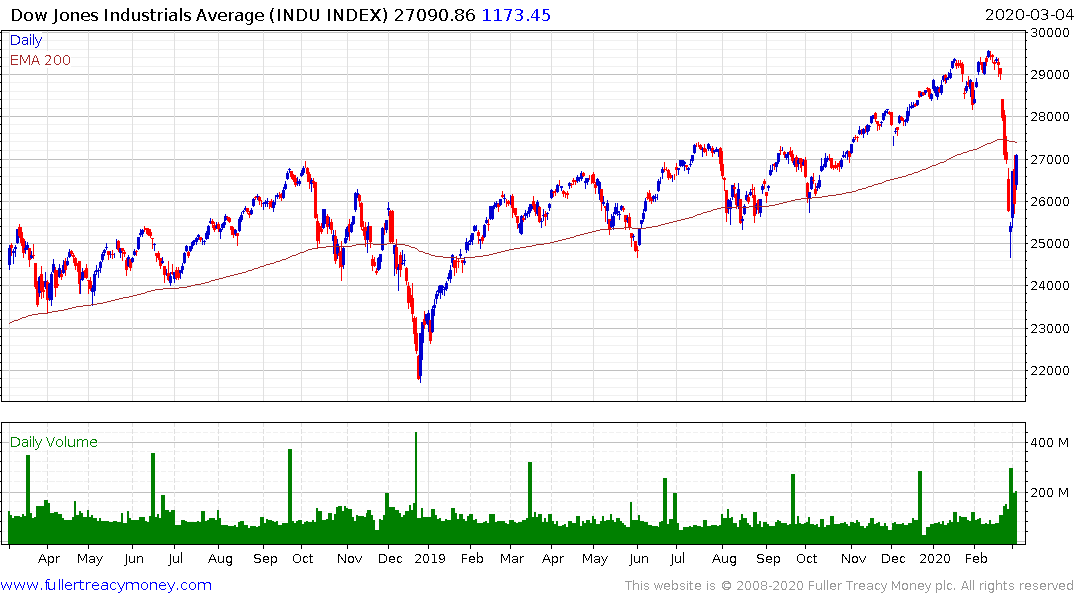
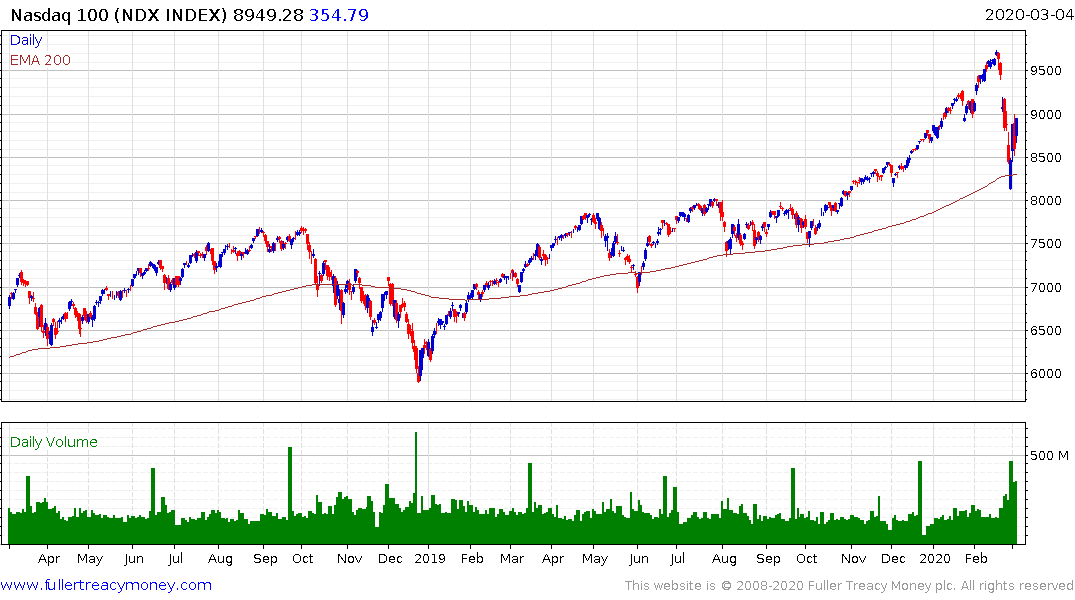
The volume data tends to be heavily influenced by reweightings in ETFs, or the indices they follow, on a quarterly basis, generally on the 20th of the month. That accounts for the spikes in September, December, March and June.
The December spike in volume in 2018 was exacerbated by the decline as well as the deep oversold condition and so was larger than the others over the last couple of years.
Over the last week, the highest volume day was on the rebound on Monday but today’s volume on the down day is the 2nd highest and suggests continued angst about what the future holds.

The S&P500 is right in the region of the upper side of its underlying trading range and just below its trend mean. This is a key level in terms of the consistency of the overall trend since breakouts from medium-term ranges over the last decade have all been sustained.
The 1000-day MA continues to trend higher and currently stands at 2636. Over the course of the last century, the Index has very rarely sustained a move below it during a secular bull market. 1962 was an exception because the Index held below the long-term MA for about six months before finally reasserting on the upside.
.png)
The Dow/Gold ratio has been trending lower for eighteen months and moved to a new reaction low today. A clear and sustained move above the trend mean will be required to question gold’s scope for continued outperformance.
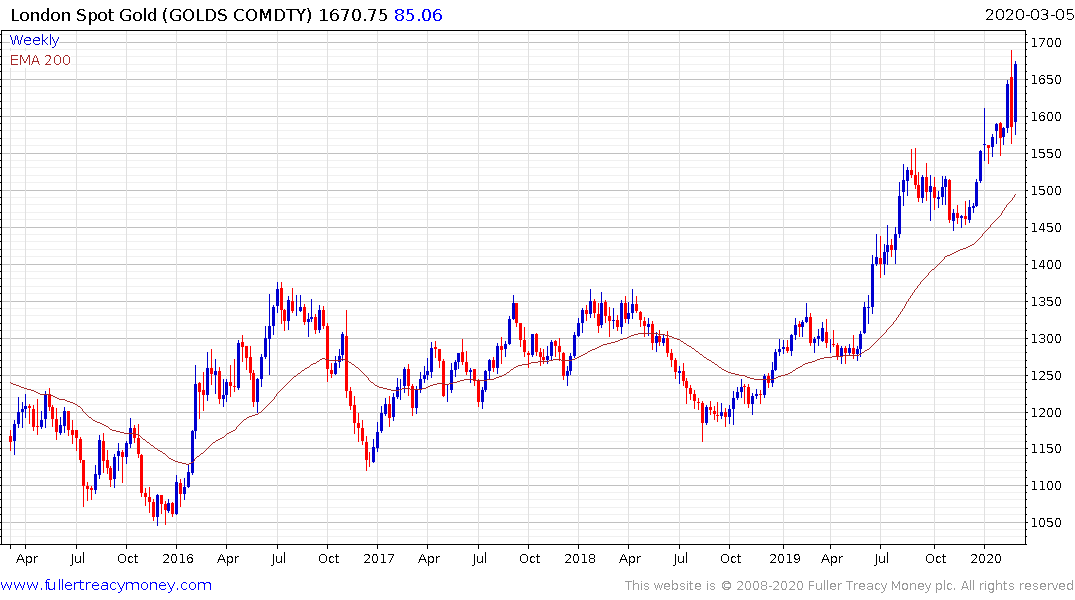
In absolute terms, gold continues to firm within its range and remains in a medium-term uptrend.
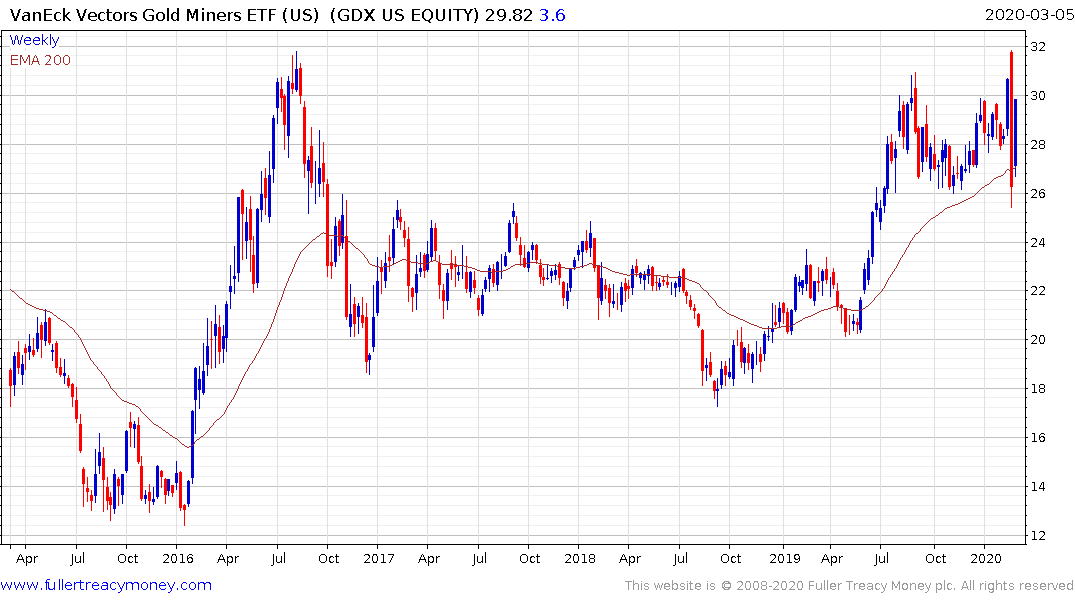
Gold shares also continue to recover following the contagion-driven sell-off last week.
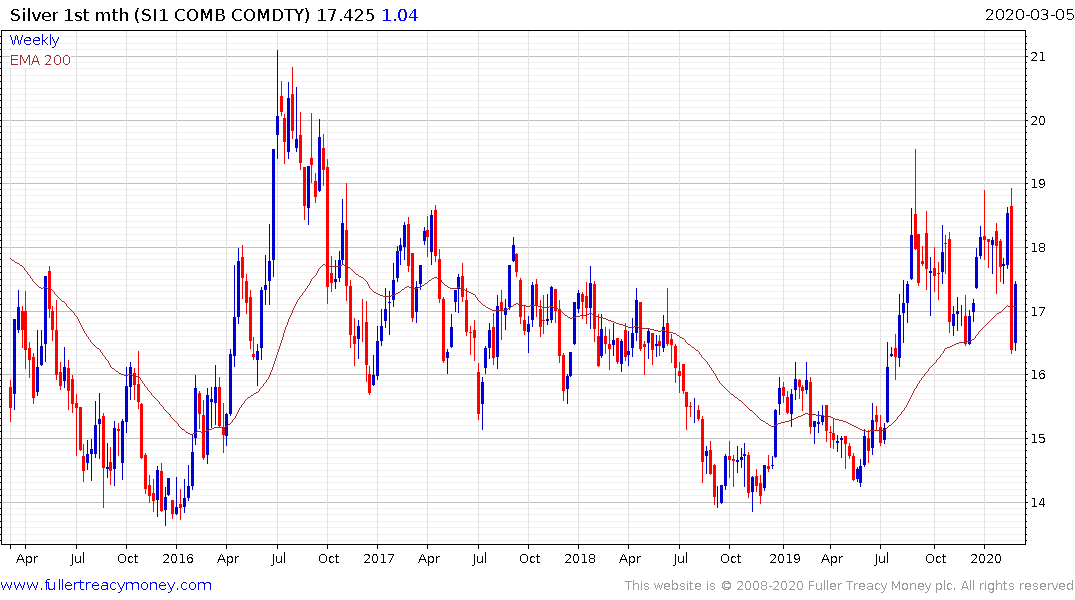
Silver is firming from the region of its trend mean and potentially in the process of forming a failed downside break below $17.