
Gold adjusted for Purchasing Power Parity in USD, GBP, AUD, CAD, EUR and CHF

Gold is a monetary metal because it has been viewed as a store of value for millennia. The question therefore is how do we best measure its performance as a store of value? Afterall, the simply looking at its value in different currencies gives us an historical perspective but it does not illustrate how much the purchasing power of currencies has been degraded over time. In order to do that we need to create charts of gold adjusted for the purchasing power parity of various currencies.
In researching this question, I found it particularly interesting how various measures of purchasing power parity are quoted internationally. The USA for example quotes its measure as how many fewer items one Dollar can buy now than in the past. However, the rest of the world quotes the data the other way around. For example, the UK measure quotes it as the number of pounds now required to buy what one pound bought in the past.

The price of gold adjusted for US Dollar PPP peaked in the region of the 1980 highs in 2011. It pulled back violently but is again approaching the 250 area. Considering the range underneath the price, some consolidation in the region of the previous peaks is certainly possible but a breakout is the most likely medium-term scenario.
 2020-07-16 11-50-36.jpg)
The price of gold adjusted for British Pound PPP data starts in 1982. The price declined meaningfully into the low in 1999 and then rallied by almost 8X to the 2011 peak. It paused in the region of the high last year and has now clearly broken on the upside.
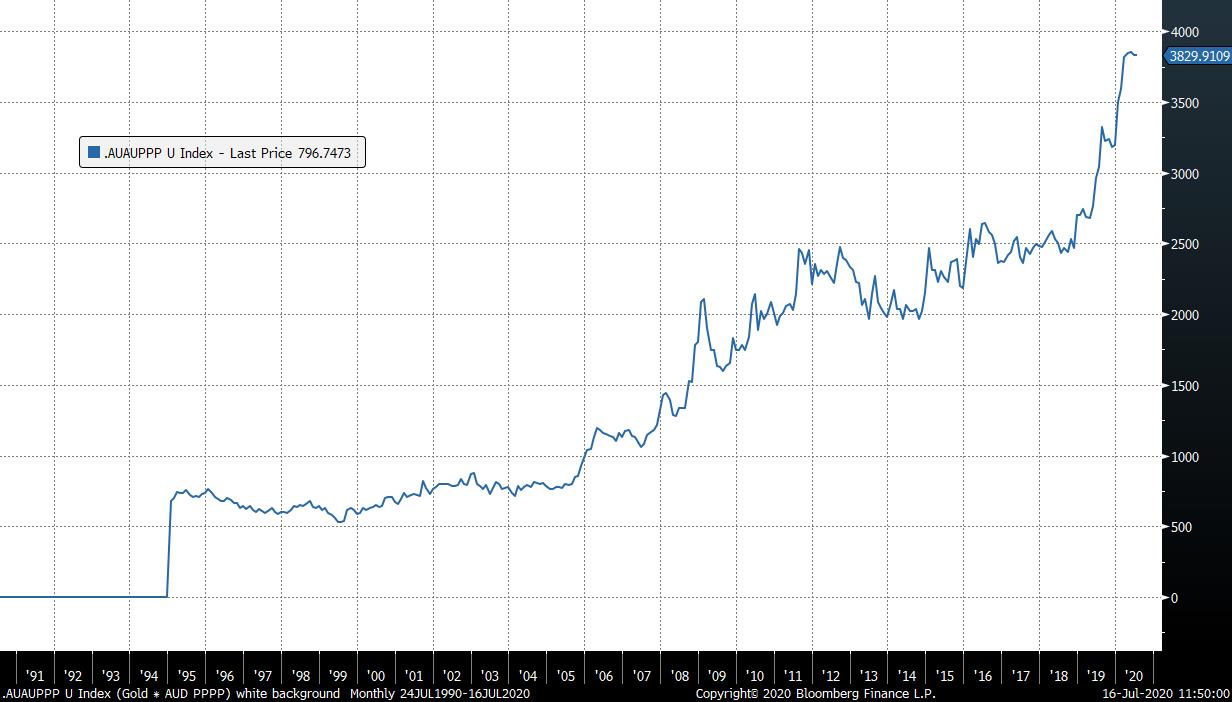
The price of gold adjusted for Australian Dollars PPP data starts in 1994. It broke out in 2005, hit a medium-term peak in 2011 and resumed its uptrend in 2019.
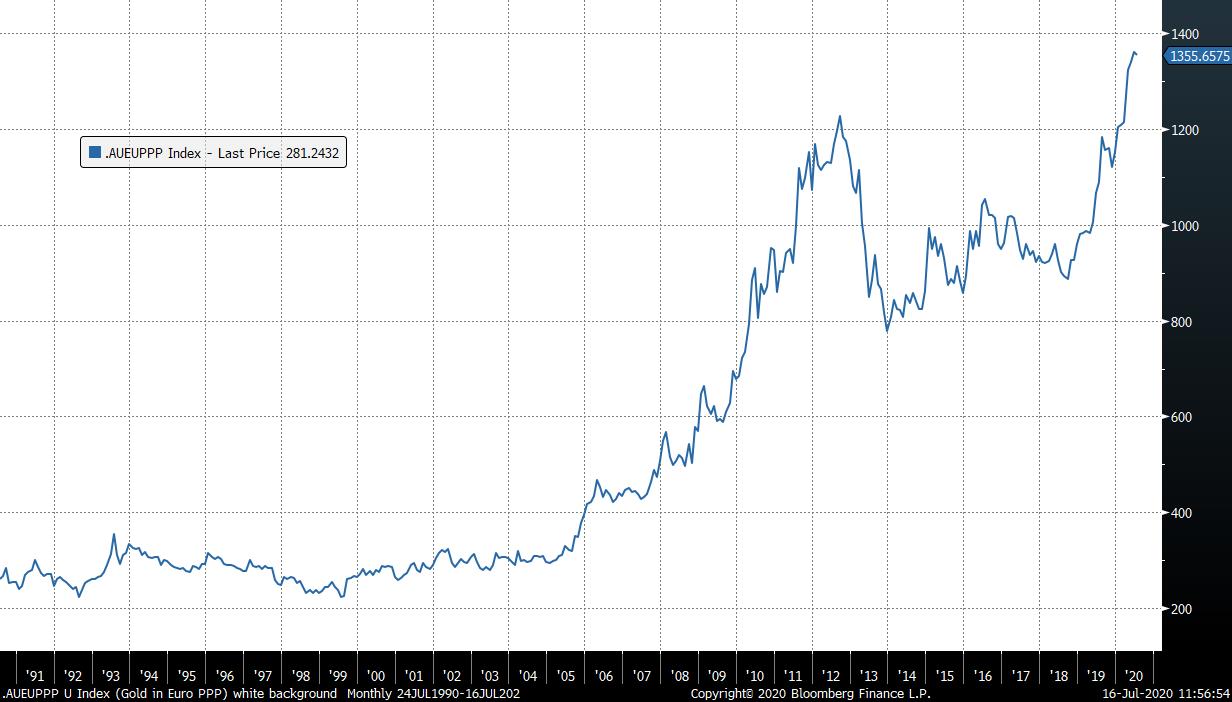
The price of gold adjusted for Euro PPP is an interesting one because the purchasing power of the Euro actually increased in the 1990s before declining over the last twenty years. The chart out in 2005, peaked in 2012 and broke out again this year.
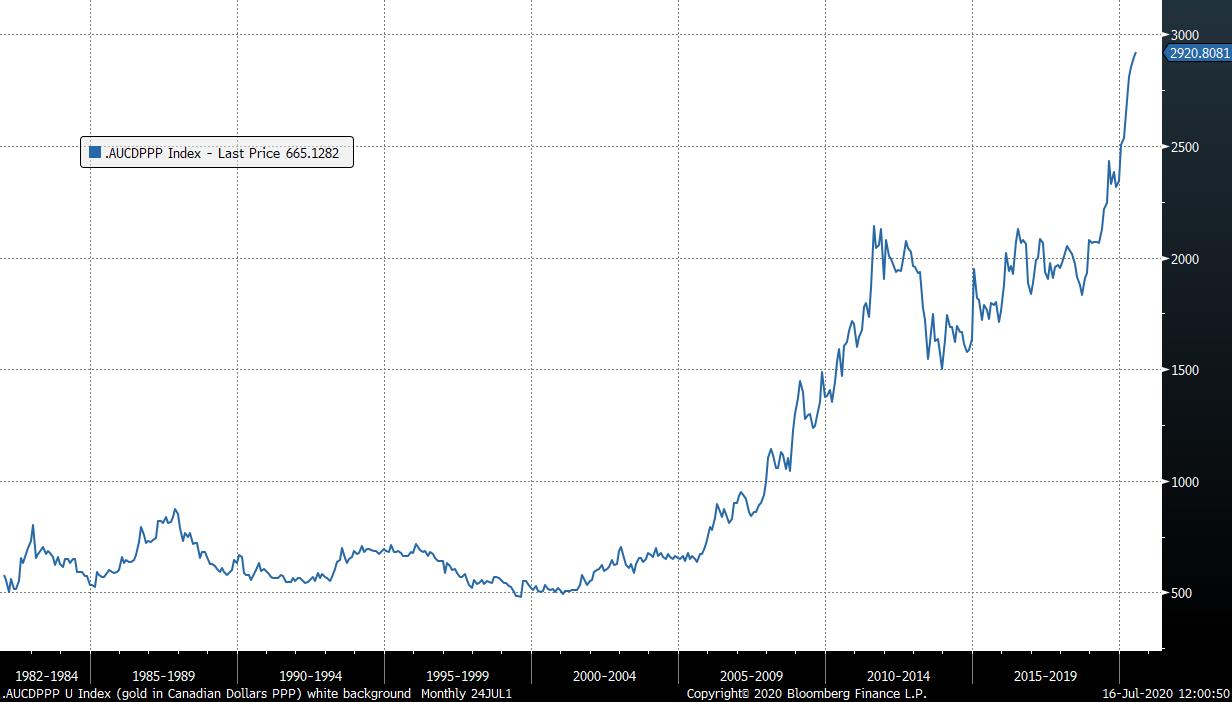
The price of gold adjusted for Canadian Dollar PPP ranged for more than 25 years before breaking out in 2006. It ranged again between 2011 and 2019 before breaking out again.

The price of gold adjusted for Swiss Francs PPP exhibits a more pronounced downtrend from the start point in 1982 and has just broken on the upside.
The commonality across just about all of these measures is very supportive of the view gold is in a significant new bull market, even with short-term risk of consolidation in the region of $1800.
Back to top