
Email of the day on global liquidity:
The emphasis you have given to liquidity as a principal driver of equity markets is being vindicated as prices continue to rise despite slowing money supply. See attached article from Mises.

Thank you for this interesting article. Here is a section:
Money supply growth can often be a helpful measure of economic activity. During periods of economic boom, money supply tends to grow quickly as banks make more loans. Recessions, on the other hand, tend to be preceded by periods of falling money-supply growth.
Many factors contribute to these trends. In recent months, money supply growth — in both M2 and TMS — has likely been impacted by falling growth rates in real estate loans at commercial banks. In January, real estate loans grew 2.9 percent, year over year, which was a 49-month low. The demand for mortgage loans has softened as mortgage rates have risen. In January, the 30-year, fixed average mortgage rate reached 4.46 percent, which was down from November's recent high of 4.87. January 2018's average mortgage rate was much lower, however, coming in at 4.03 percent.
The problem with relying on the expectation that bank loan growth is a reflection of economic activity is banks have been hindered in their ability to make loans because of the damage done to their balance sheets during the credit crisis. Instead of lending they have been lodging excess reserves at the Fed in return for a modest, but risk-free interest rate.
They have also been pursuing other business lines outside of prop trading and mortgages. That is the clearest rationale for paying attention to the size of the Fed’s, and other central banks’, balance sheets. In today’s world they represent the clearest sign of how much capital is available to support asset prices. Afterall as investors we occasionally need to be reminded that we buy companies not countries.
My central bank total assets chart hit at least a medium-term peak in March and trended lower until November. Since then it has rebounded but a sustained move above $20 trillion is going to be required to signal global liquidity is back on an expansionary footing beyond the short term.
The two big inputs in this measure are the QE programs of central banks and the Dollar’s strength or weakness against the input currencies. The Fed is still reducing the size of its balance sheet even as it pauses on rates. The ECB said it has ended it QE program but there is little evidence of that yet. The Bank of Japan and People’s Bank of China are still on expansionary footings and I believe the Bank of England has also recently started to inflate the size of its balance sheet ahead of the Brexit date.
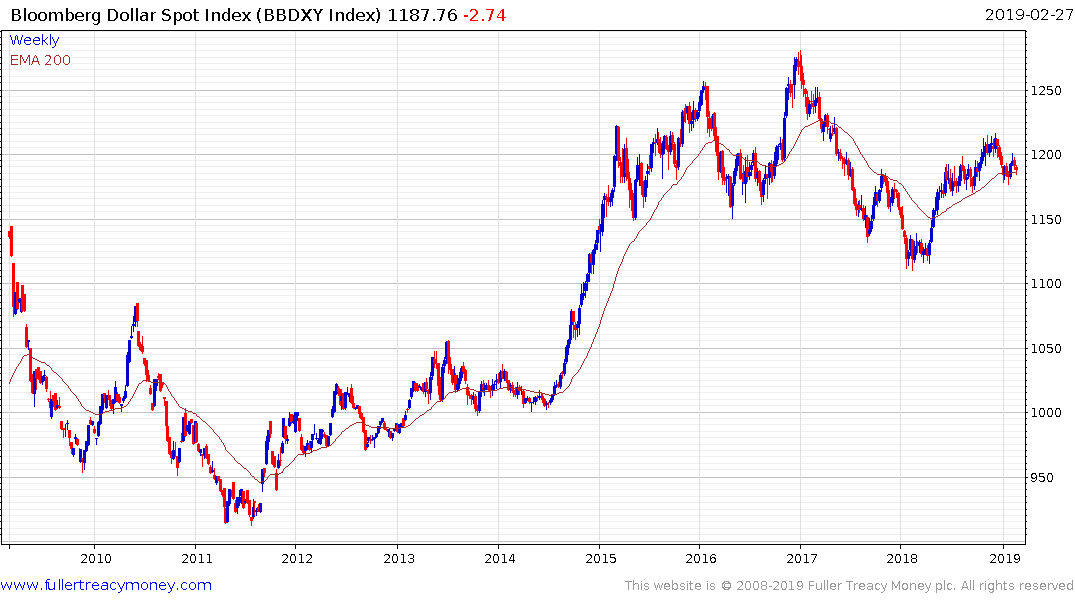
Meanwhile the Dollar’s strength last year siphoned reserves out of other central banks by making their domestic reserves worth less. The Bloomberg Dollar Index, which is less influenced by the Euro than the traditional US Dollar Index, spent most of 2018 trending higher. It is now testing the region of the trend mean and will need to hold the 1175 area if higher to lateral ranging is to be given the benefit of the doubt.