Email of the day - on when to use point and figure charts
Thanks for your very clear and objective commentaries at moment. It is good that you are looking beyond the current crisis and thinking about what investments are likely to do best over the longer term. I notice that you have been referring to point and figure charts more recently. Under what circumstances do you find it best to use these, rather than a 'standard' daily / weekly price chart? Also, what do you recommend using for box size / reversal as an unleveraged investor, taking a medium / long term view?
Thank you for this question. It was pointed out to me at the last Chart Seminar that it had historically always been conducted using point and figure charts and that David had been known as a point and figure analyst so what caused the change.
David’s Chart Craft business produced chartbooks because they were the only way to get good charts before the internet changed everything. Point and figure allows one to look at a vast amount of history in a very condensed area and since the patterns do not change all that often, they were ideal for a monthly publication. When I started to work with David in 2003, just as we transitioned to a fully online service, the only time I saw David use p&f was at The Chart Seminar.
P&F is best in my opinion for investors rather than traders. We have always used closing prices, a 3-box reversal and the system defaults to a 2% box size. However, p&f charts need to be tailored and that is why a custom box size option is available.
I think p&f charts are most useful for clearly depicting how a trend’s consistency has broken down.
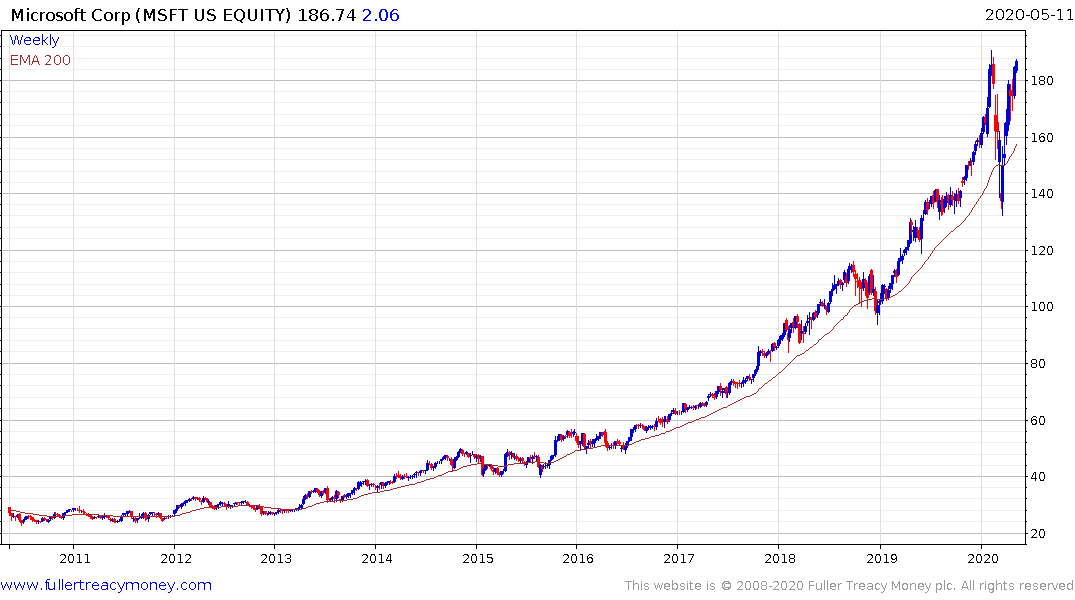
Contrast the weekly candle and p&f charts for Microsoft.

The candle has a clear uptrend, and a bigger pullback recently following a significant acceleration in the rate of the advance. However, the broad trend is still upwards and it has continued to find support in the region of the trend mean.
.png)
The p&f clearly highlights the succession of ranges one above another, the acceleration, then the much larger pullback and wider pattern overall. There is no doubt the share has rebounded impressively but it would be very difficult to claim the trend is still consistent.
In fact, there is an acute risk of consolidation in the near term. The last three pullbacks have been between five and four boxes deep. The box size is $3.52. Therefore, a reaction of more than $18 would signal another inconsistency and potentially a lengthier period of consolidation, if not top formation extension.
Back to top

