
Could Stock Picking Matter More Than Sector Positioning This Year?
Thanks to a subscriber for this report from UBS which may be of interest. Here is a section:

Here is a link to the full report and here is a section from it:
The evolution of economic prospects will inevitably play a large role in determining the next phase of leadership. Our expectation is that leading indicators will likely deteriorate further as they gradually digest last year's rate hikes. If and when the ISM New Orders does break below the critical 50 threshold, we would expect to see yet another shift in leadership toward an even more defensive set of market leaders.
As a general statement we favor the growth-ier and counter-cyclical sectors of the S&P 500. That said, we expect prospects abroad, in Asia more specifically, to recover earlier than those in the U.S. and thus see segments of the S&P 500 with foreign exposure finding support in those trends. In essence, we expect investors to seek out companies with risk-off attributes but specifically those that generate revenues abroad, and in Asia more particularly. This unusual mix of factors makes us think that stock selection might just matter more than sector selection in 2019. Indeed, the cross-currents we see for data in 2019 will likely throw a wrench in the typical playbook this year and leave us with some uncommon leadership trends.
The basic premise of our framework is the notion that Fed policy is the most powerful influence for financial markets. Indeed, interest rates pack a big punch in an economy like the U.S. where consumption accounts for a full 68% of GDP. One concept that is often hard to grasp for investors is just how long it takes for a change in rates to be fully reflected in economic data. In the case of leading indicators, and financial markets by the same token, we are talking about 18 months. It takes 18 months for Fed policy to be fully reflected in leading indicators of the economy. In this context, the process of digesting the Fed's rate hikes from 2018 is still very much under way and argues for lower leading indicators ahead. More simply, however, the mere knowledge that the yield curve is currently inverted should make a slowdown in the economy a risk to be considered by every investor. In fact, economic prospects slowed in 7 of the last 7 inversions in the yield curve.
The Federal Reserve aggressively tightened policy last year by both raising rates and reducing the size of its balance sheet simultaneously. That has had more of an effect on international growth than domestic growth but the underperformance of the banking and industrial sectors is a testament to slowing activity. We are at the point in the cycle where we can expect easier policy. The big question is whether the Fed will act soon enough to avoid negative economic figures.
.png)
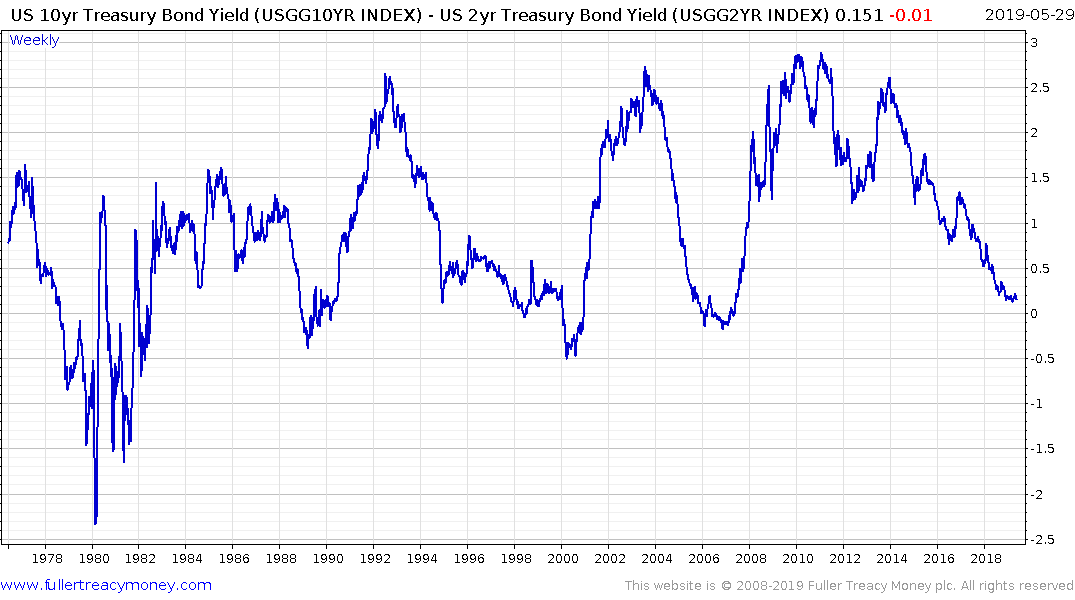
There is a raging debate going on about whether the yield curve is inverted or not since the 10-2 spread is the classic chart to monitor and is not inverted but the 10yr - 3mth chart is. Therefore, confirming evidence is required. The ISM New Orders Index dropping below 50 in tandem with a yield curve inversion, regardless of how that is defined, would be an incontrovertible signal of slowing economic activity and recession risk.
The Index is currently sitting at 51.7and trending downwards.
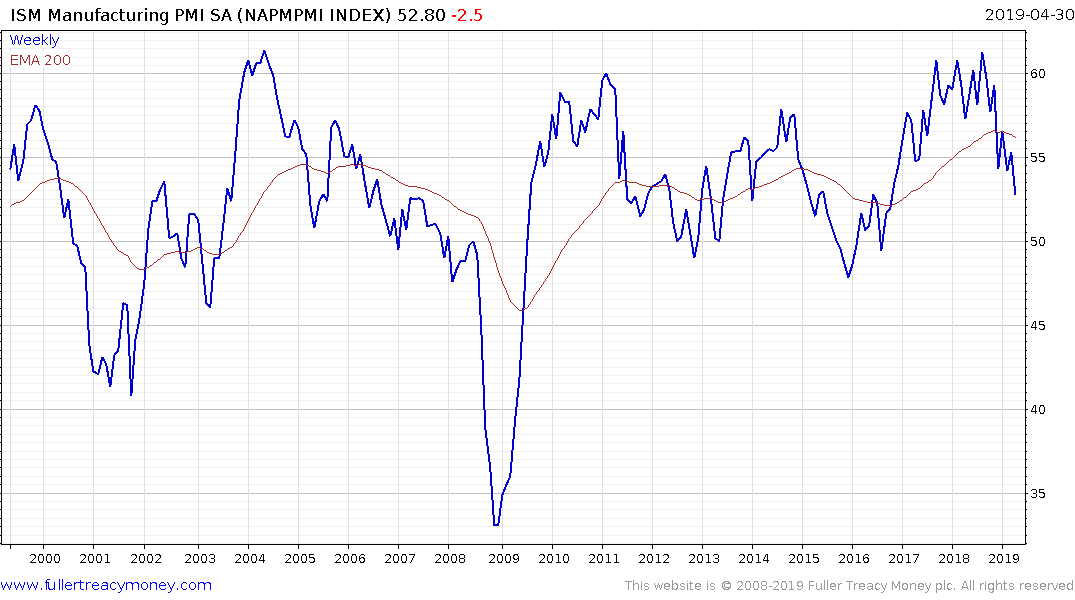
The ISM Purchasing Managers Index is at 52.8 and trending lower.
The time is now for the Fed to act, or for the trade war to improve. In its absence the stock market is going to experience a further headwind.
.png)
Right now, the S&P500 is testing the region of its trend mean (200-day MA). This is a potential area of support and there is some evidence of steadying. Considering how wide the overbought condition was following the rebound from the December low, there is an argument for giving the Index some room in which to consolidate.
.png)
If we look at long-term charts, the 1000-day moving average has been an important area of support for secular bull markets. That was certainly the case between 1983 and 2001 and it has equally been important between 2011 and now. The December low was the last time this moving average was tested and a sustained move below it would raise big questions about the secular bull market argument.