
Can the Synchronous Recovery Last?
Thanks to a subscriber for this report from Morgan Stanley which has a number of interesting nuggets. Here is a section:
For the first time since 2010, the global economy is enjoying a synchronous recovery (see chart). The developed markets’ (DM) private sector is exiting deleveraging after several years of slow growth due to a focus on balance sheet repair and, after four years of adjustment, the emerging markets are in a recovery mode. These trends create a positive feedback loop. Indeed, the DM economies account for 60% of emerging market (EM) exports, so as their real import growth accelerates, EM exports are rebounding. What’s more, an improving EM outlook reduces DM disinflationary pressures.
How sustainable is this recovery? Typically business cycles end with macrostability risks (price, external and financial) spiking, forcing policymakers to tighten monetary and/or fiscal policy. In this cycle, considering that emerging markets inflation and current account balances are moving toward their central banks’ comfort zones, it is unlikely that macrostability risks will surface soon. Moreover, the emerging markets now have high levels of real rate differentials vis-àvis the US, providing adequate buffers against normalization of the Federal
DEVELOPED MARKET RISK. In our view, the key risk to the global cycle is apt to come from the developed markets— most likely the US, considering that it is most advanced in the business cycle. Moreover, the US tends to have an outsized influence on the global cycle, particularly the emerging markets. While price stability features prominently in debating the monetary policy stance of any central bank, financial stability is clearly emerging as an equally important factor.
How will it play it out? For insight, we can look at history. The late ’60s saw fiscal expansion at a time of strong growth and low unemployment. In the mid ’80s, the US pursued expansionary fiscal and protectionist policies in an improving economy. We look at similarities and differences versus today, analyzing asset class performance by fiscal deficit and unemployment quartiles.
To that end, private-sector leverage has picked up modestly in the US. In fact, the household-sector balance sheet, which was the epicenter of the credit crisis, had been deleveraging until 2016’s third quarter. Moreover, the regulatory environment has been relatively credit-restrictive. Hence, we see moderate risk to financial stability. However, risks could rise, considering that monetary policy is still accommodative, and particularly so if the administration eases financial regulations. Price stability is a critical risk, too—especially since the core Personal Consumption Expenditures Index inflation rate is close to the Fed’s target and US unemployment is around the rate below which inflation could accelerate. Reflecting this, we expect the Fed to hike rates six times by year-end 2018 (see page 3). We expect other major DM central banks to take a less dovish/more hawkish stance

Here is a link to the full report.
.png)
The MSCI World Index broke out to new all-time highs in March and continues to extend that breakout. There is no denying that the Index is heavily weighted by the USA but it has been a generally firm period for global stock markets as economic growth figures pick up against a background where interest rates are still relatively accommodative.
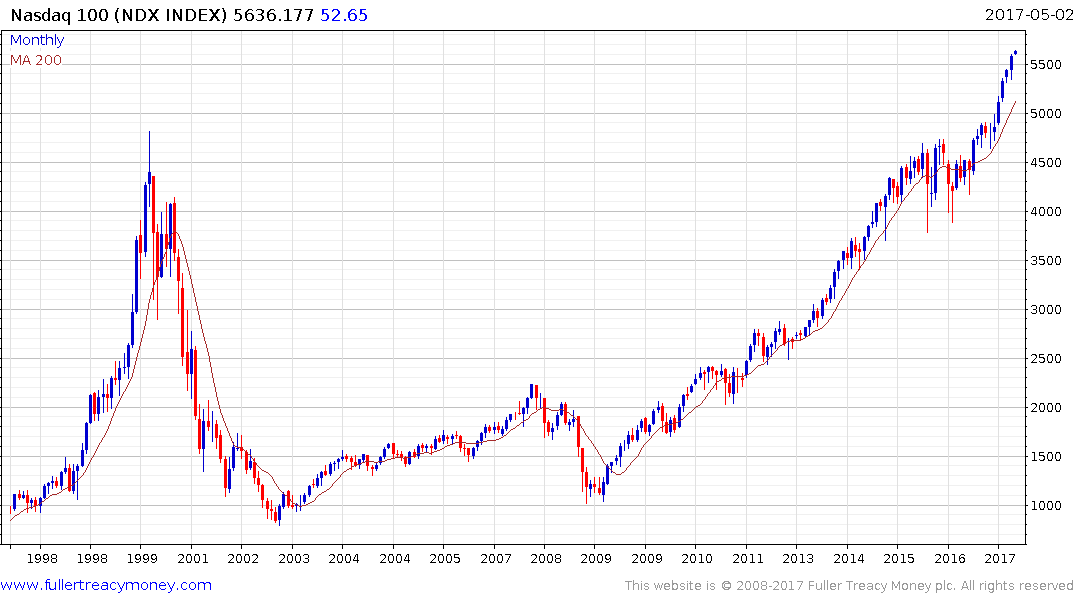
The Nasdaq-100 spent two years ranging in the region of the 1999 peak and broke out in December to post new all-time highs. It is increasingly overextended relative to the trend mean but there is little evidence of a loss of momentum
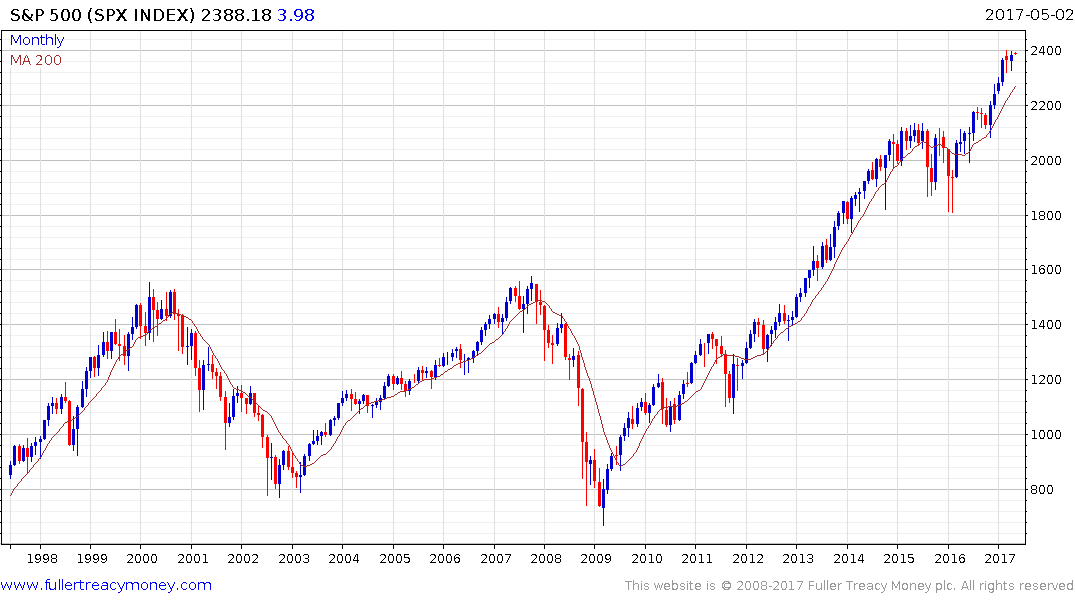
The S&P500 has paused in the region of 2400 but a sustained move below the trend mean would be required to question medium-term scope for additional upside.
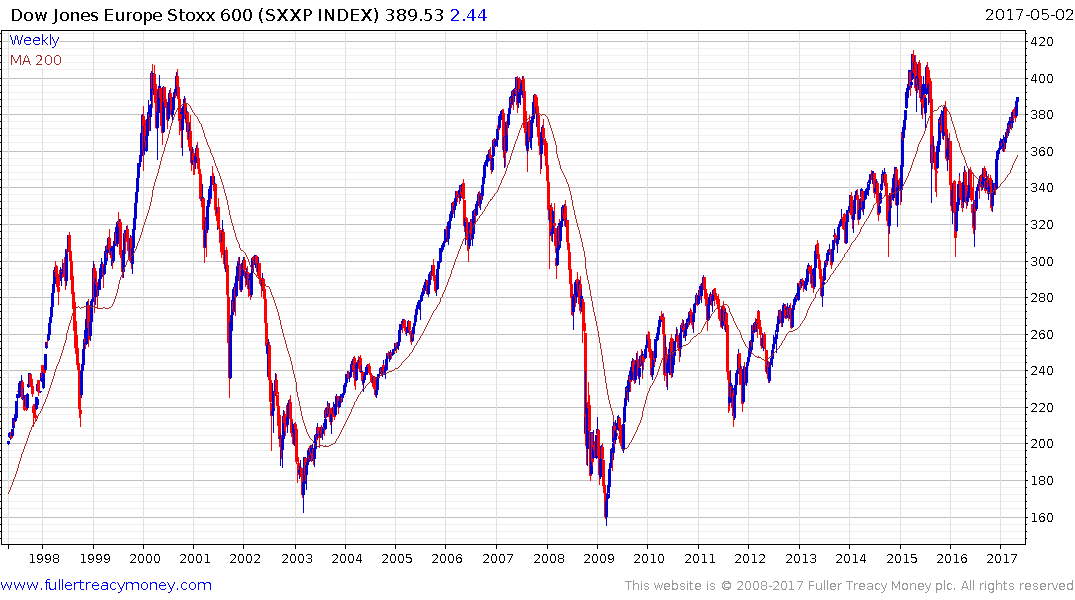
The Europe Stoxx 600 Index has been subject to pronounced bouts of volatility over the last 17 years.The Index retested the 2000 and 2007 peaks in 2015 but experienced a sharp pullback and is only now pushing back up to test the highs.
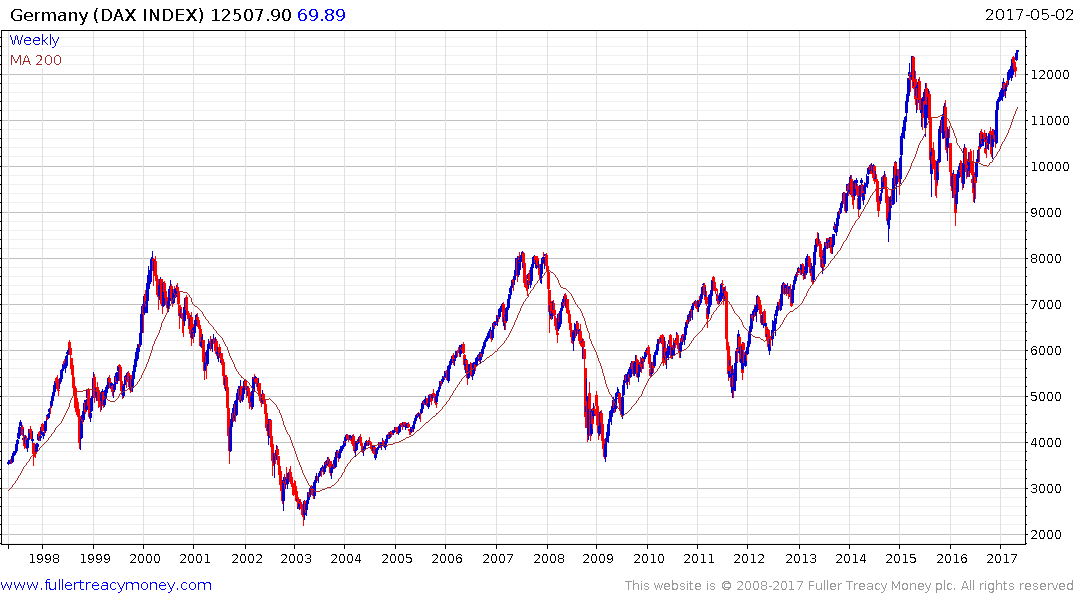
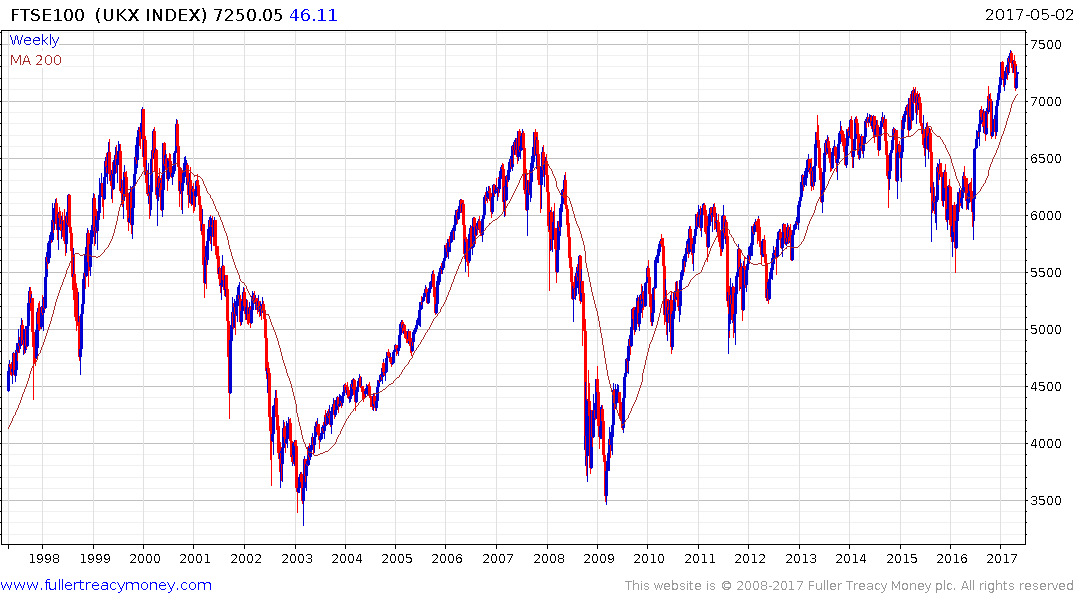
Some highlights within Europe are the German DAX which has a broadly similar pattern of the Nasdaq and the FTSE-100 which is in the process of completing a 17-year range.
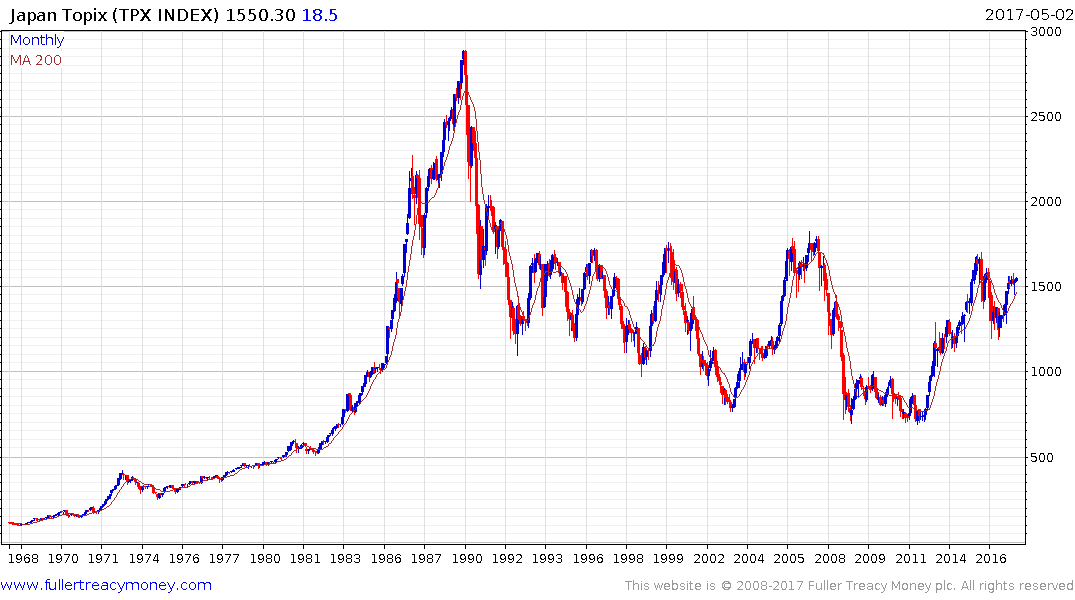
Japan’s broad Topix Index has been ranging below 1750 for 24 years. It has held the majority of the advance from the 2013 lows and is firming once more. A break above 1750 would confirm a new secular bull market is unfolding.
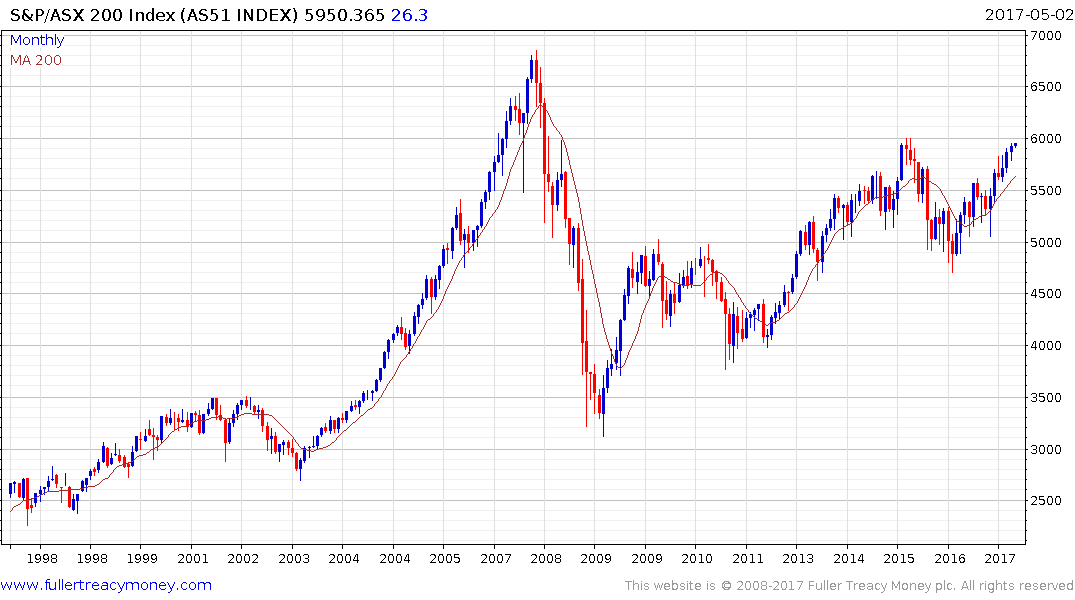
Australia’s S&P/ASX 200 hit an accelerated peak near 7000 in 2007 and is currently testing the psychological 6000. A break in the short-term progression of higher reaction lows would be required to question recovery potential.
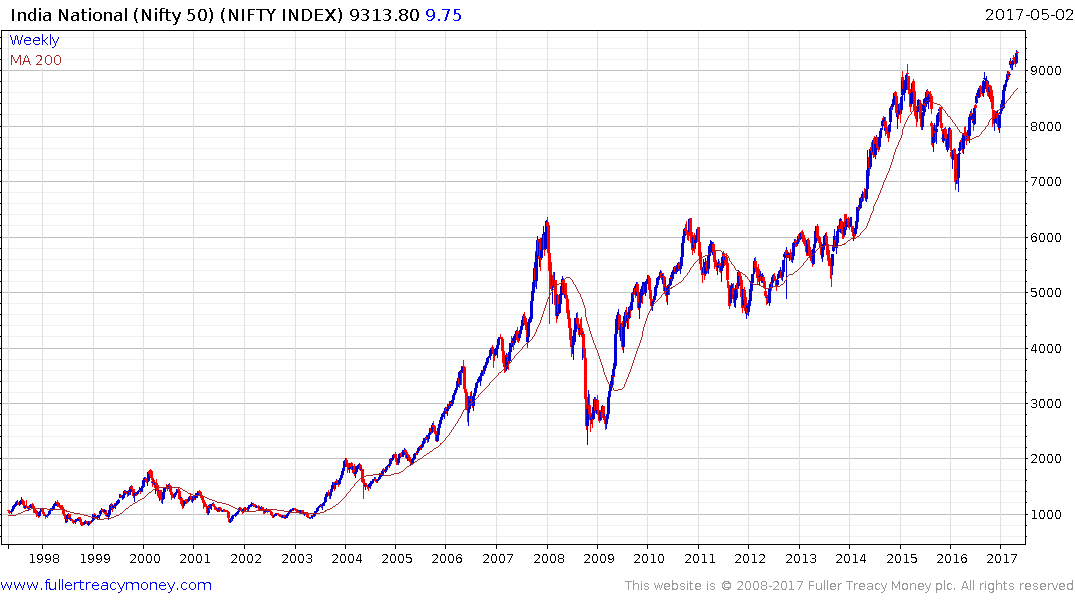
India’s Nifty Index has completed a two-year range to resume the secular expansion.
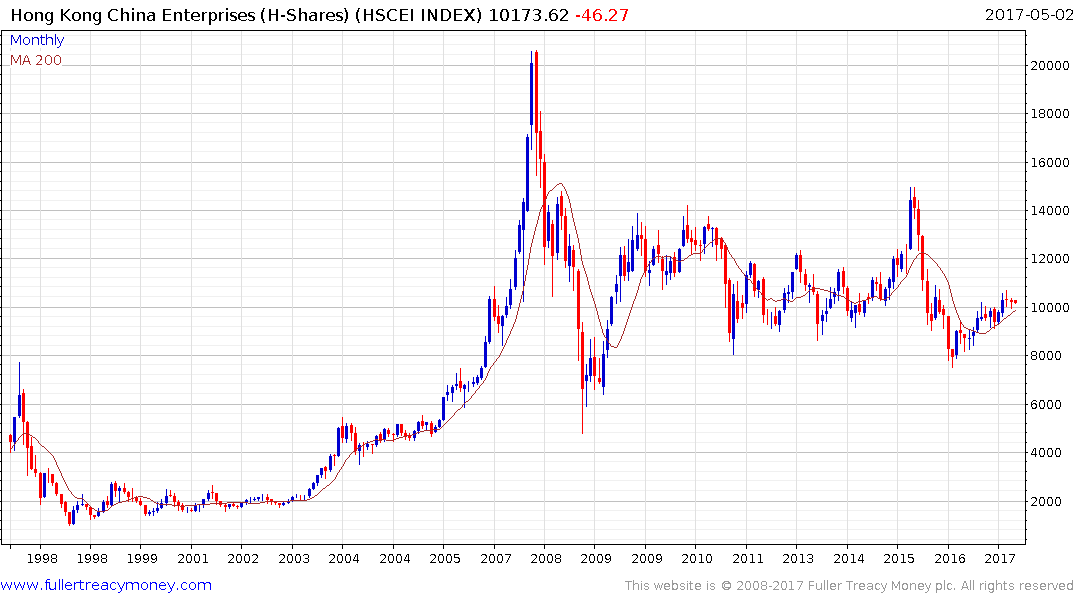
China’s H-Share Index continues to range following the bubble peak in 2008 and will need to hold the psychological 10000 level if potential for higher to lateral ranging is to be given the benefit of the doubt.
Taken in aggregate we can conclude that this is a period of synchronised stock market expansion and while short-term overbought conditions are increasingly evident there is little sign yet of a loss of momentum much less topping activity.