
Asia Ex-China

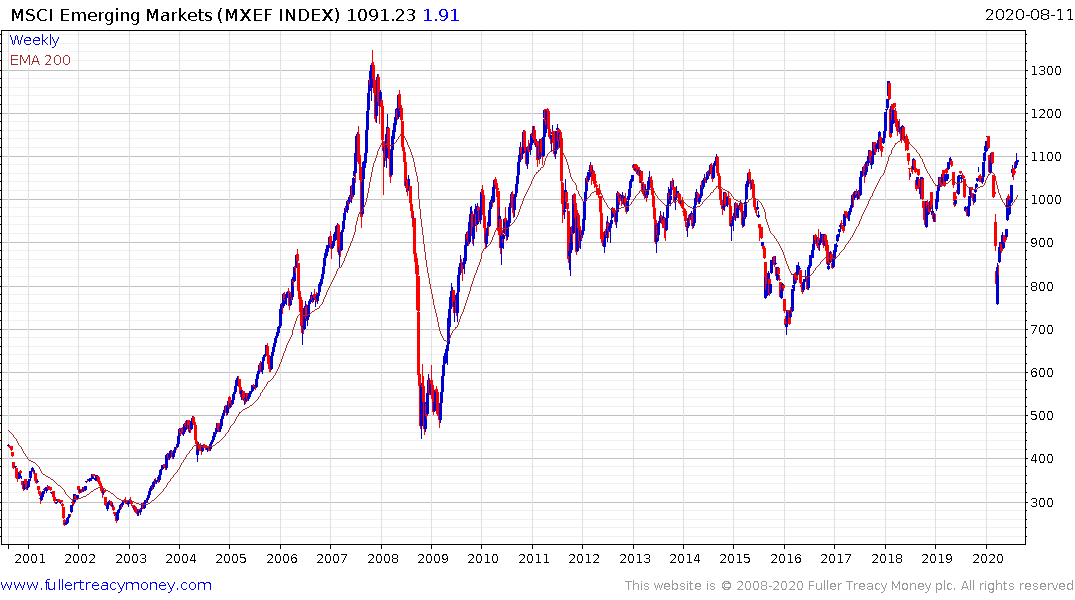
A question that has been bugging me for a while is how well are Asia’s markets performing on aggregate? The MSCI Emerging Markets Index is heavily weighted by China and by commodity producers dependent on China. Therefore, it does not give us an accurate picture of what is happening the rest of the emerging universe.
It understandable that there has been little demand for ex-China exposure since it represents such a massive weighting in the sector and in the global economy. However, as geopolitical tensions rise between the world’s two largest economies, it is a good time to attempt to evaluate the relative merits of avoiding or leaning into investing in China.
The MSCI World with China Exposure Index contains any company that does business in China. That means companies like Apple, Tencent and Alibaba will all have weightings. The Index ranged mostly below 1750 between 2007 and 2017 before breaking about. Since then it has ranging mostly above that level but rebounded impressively from the March lows and it now at new highs. This performance supports the view that many of the best performing companies have significant exposure to China.
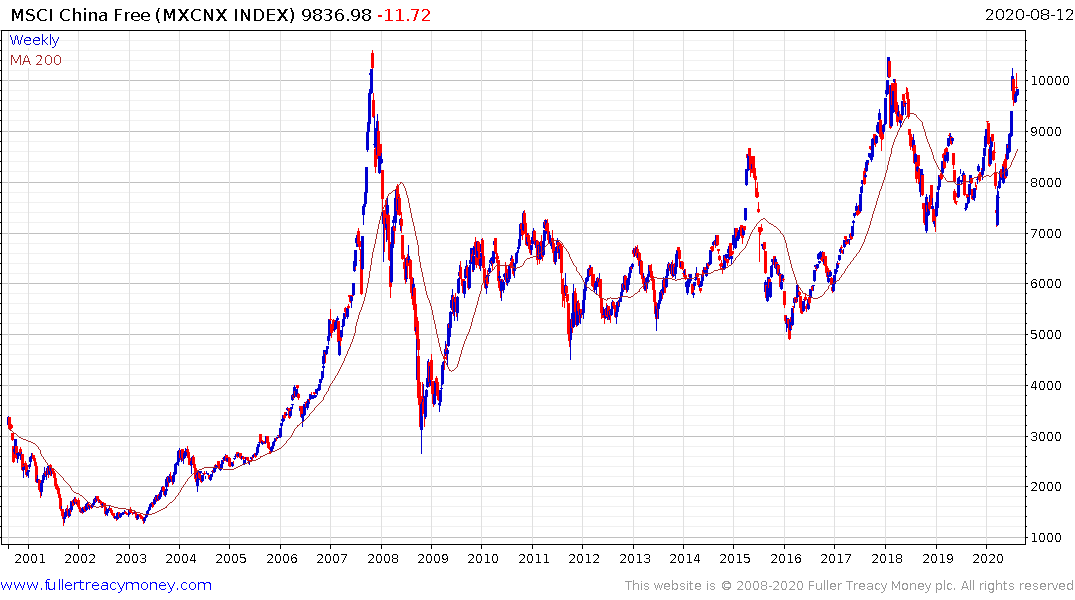
The MSCI China Index peaked at 100 in 2007, briefly surmounted that level in 2018 and is back testing it again now. A sustained move above 100 will be required to signal a return to demand dominance. This index is mostly comprised of various kinds of Hong Kong listed shares.
The MSCI China Overseas Index is comprised of US and Singapore listed shares. It has similar pattern to Alibaba; breaking out of a two-year range in June.
There is now a new futures contract trading in Singapore for the MSCI Emerging Markets Asia ex-China exposure. The Index is quite new and only has 1 year of history. It also collapsed in March and has now recouped the entire decline.
The MSCI ASEAN Index performed admirably between 2008 and 2013 but has since underperformed. The Index collapsed in January and has since rebounded to test the region of the trend mean. It needs to sustain a move above the trend mean to confirm a return to medium-term demand dominance.
When rebased to US Dollars, India’s BSE500 Index briefly surmounted the 2007 peak in 2018 but was unable to hold the move. It pulled back sharply earlier this year and is now back testing the lower side of the overhead trading range. It will need to hold the lows near 150 if recovery is to be given the benefit of the doubt.
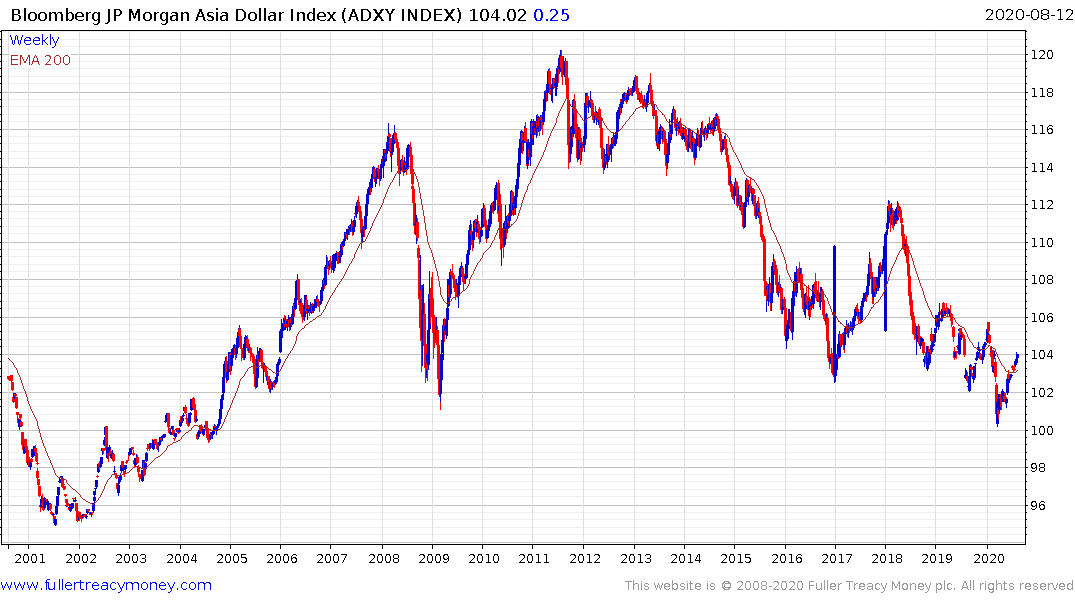
Two conclusions can be drawn from these charts. The first is that technology exposure has helped to flatter the best performers. The second is renewed weakness for the US Dollar would flatter the performance of all these indices. That is particularly true for companies that have taken out a lot of US Dollar debt.