
A Quick Survey of "Broken" Asset Classes
Thanks to a subscriber for this report from Research Affiliates which may be of interest. Here is a section:
We recognize the substantial survivorship bias in our survey, having personally survived most of these episodes ourselves! So, to be more comprehensive, we also plot other periods when these asset classes fell within their lowest decile of historical three-year rolling absolute returns.6 A similar pattern unfolds. A large majority, or 88%, of all observations (43 of 49) deliver a positive five-year return. The average five-year cumulative return across all observations is 80%, or approximately 12% a year, suggesting both the presence and strength of mean reversion.
How do the asset classes perform on a relative basis? Recall that the broken asset classes in our survey had mostly fallen short of the performance of the S&P 500 in the years leading up to the proclamation they were broken. In the subsequent three years, these asset classes surpassed the performance of US stocks on a cumulative basis by an average of 45%, or 13% a year. After five years, the cumulative excess return of REITS, commodities, small value stocks, and high-yield bonds versus the S&P 500 averaged 101%, or 15% a year. Over this five-year span, the four asset classes fared significantly better than US stocks, with cumulative excess returns ranging from 10% (high-yield bonds) to 158% (commodities).
The press is often quick to label asset classes broken. Rarely is this the case, although exceptions do exist. For instance, the German and Russian stock markets during World War I, Japanese and German stock markets during World War II, and the Egyptian stock market in the early 1950s all collapsed. The near-obliteration of a stock market has happened, but it is an extraordinary occurrence.

The epicentre of risk in a crash is the most likely to experience a lengthy Type-3 base formation following the big decline. However, even within the crashing sector, there will be companies that come through the crisis relatively unscathed. They most often show early relative strength and come to dominate in the following years. However, there will also be times when leaders underperform. That occurs most often when the weak sector convalesces. That’s when value propositions become compelling and even deeply troubled companies can do well for a while; not least because of the base effect of low prices.
Let’s look at some examples.
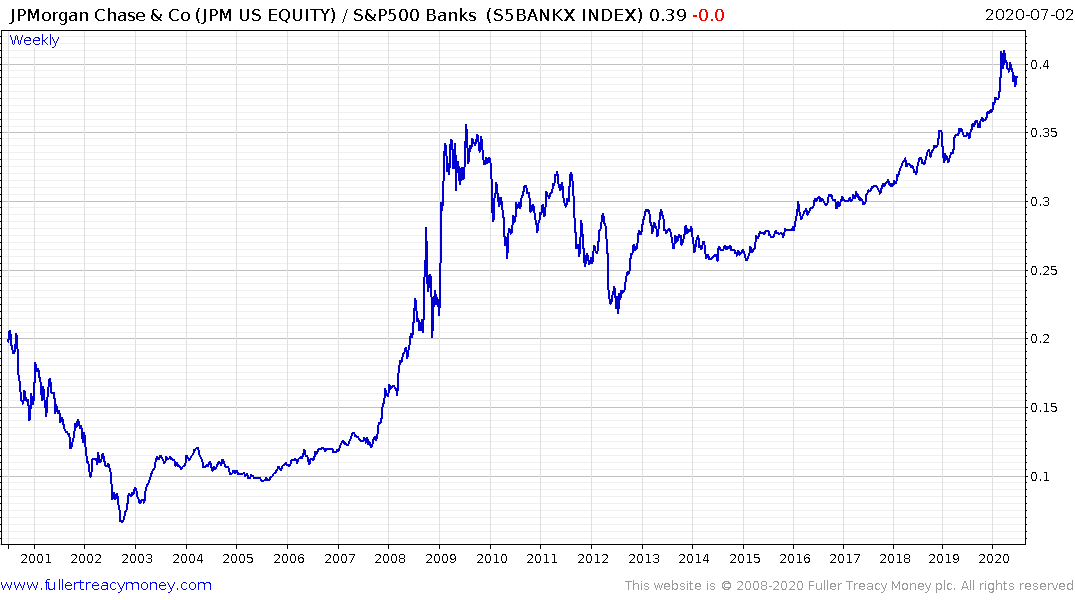
JPMorgan came through the credit crisis in a robust manner. However, it underperformed the wider banks’ sector for three years. That was because the sector stopped going down and prices were so depressed that even a modest improvement contributed to large percentage gains from the lows. The stronger fundamentals of the leader were reasserted in 2014 and it has been outperforming until quite recently.
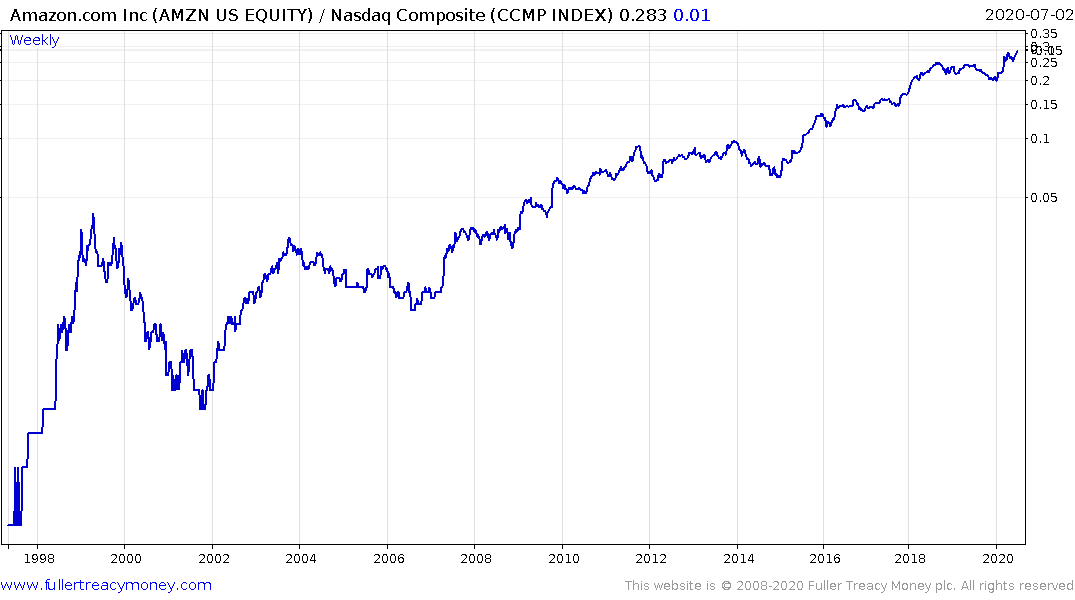
Amazon peaked relative to the Nasdaq in April 1999 fell much faster into the low in late 2001. It has regained its relative peak by the end of 2003. There have been occasions when it underperformed over the last 16 years but the relative trend has remained intact.
.png)
It might be tempting to look at the fact the three biggest cruise companies are up almost 100% in the last three months but their relative performance is still abysmal. That suggests it is too early to think about the sector returning to a relative recovery scenario.
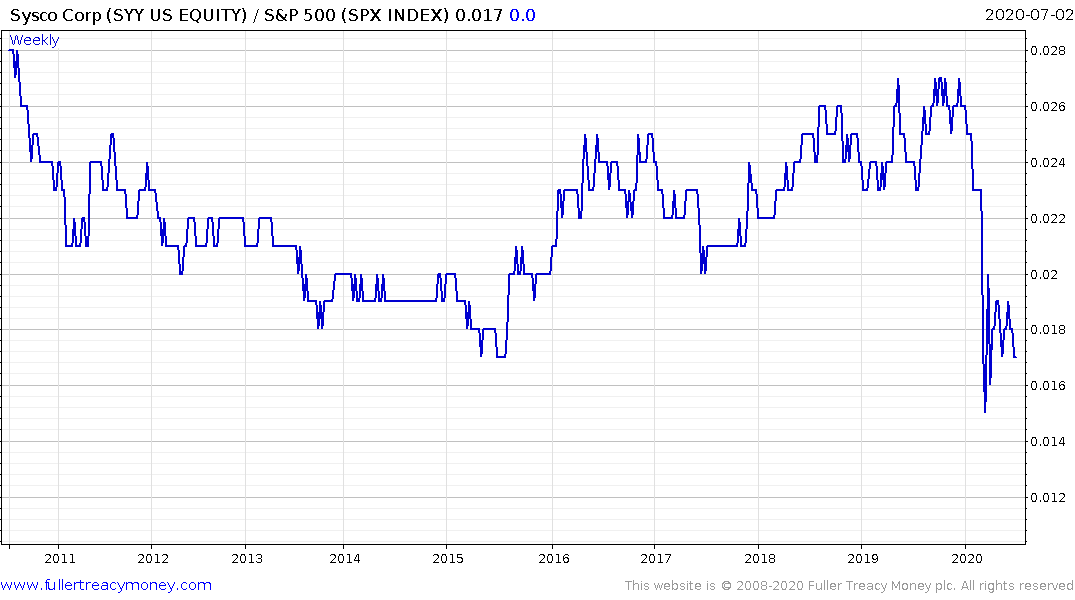
Sysco is a dividend aristocrat and perhaps the biggest supplier to the travel and restaurant services sector. It also more than doubled from its low but has rolled over as restrictions on opening up tightened.