
50-day Moving Averages

A moving average is a trend smoothing device that lags by definition. Two of the most commonly watched are the 200-day and the 50-day. The first is the rough average of a year of trading while the latter represents about a month of trading. Both represent potentially important psychological levels where investors reassess.
Nevertheless, markets tend to overshoot so looking at the region of the moving average is more fruitful than focusing on exact levels. That is particularly true since there are a number of different ways of calculating a moving average.
It’s an interesting time to think about the relevance of these moving averages. Generally, the 200-day is a useful barometer of the medium-term trend. However, during strong momentum moves, like we have seen since March, the 50-day is favoured. Part of the reason for that is because leveraged investors are incapable of tolerating deep pullbacks without liquidating positions.
The last time the 50-day was relevant to investors was in 2017. That was the year when the market didn’t look back. The rally began immediately following the election in 2016 and didn’t pause until 2018. The 50-day moving average was a point where investors bought the dip on repeated occasions.
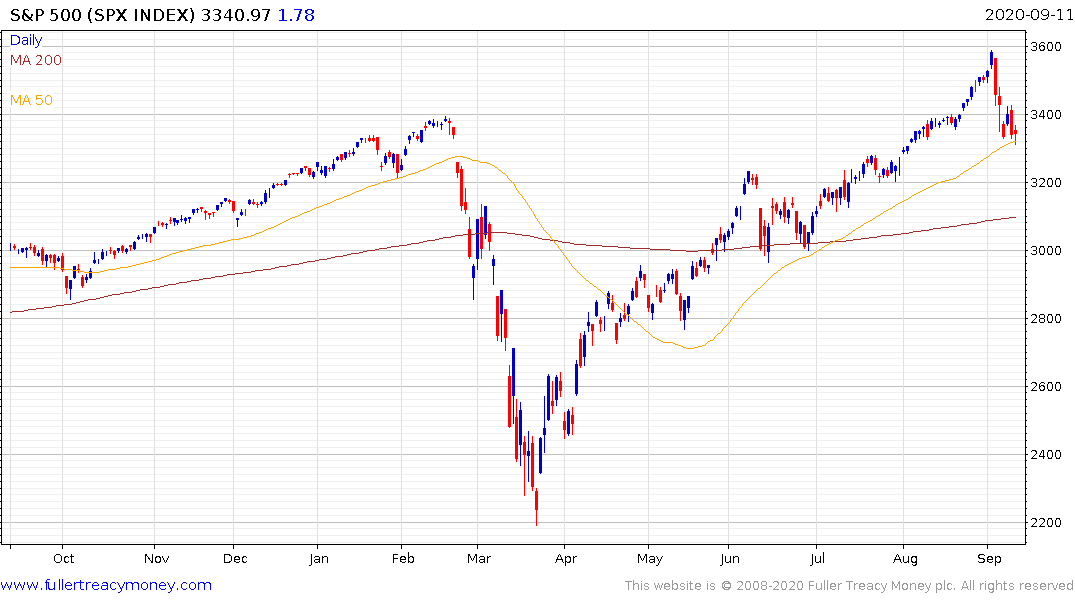
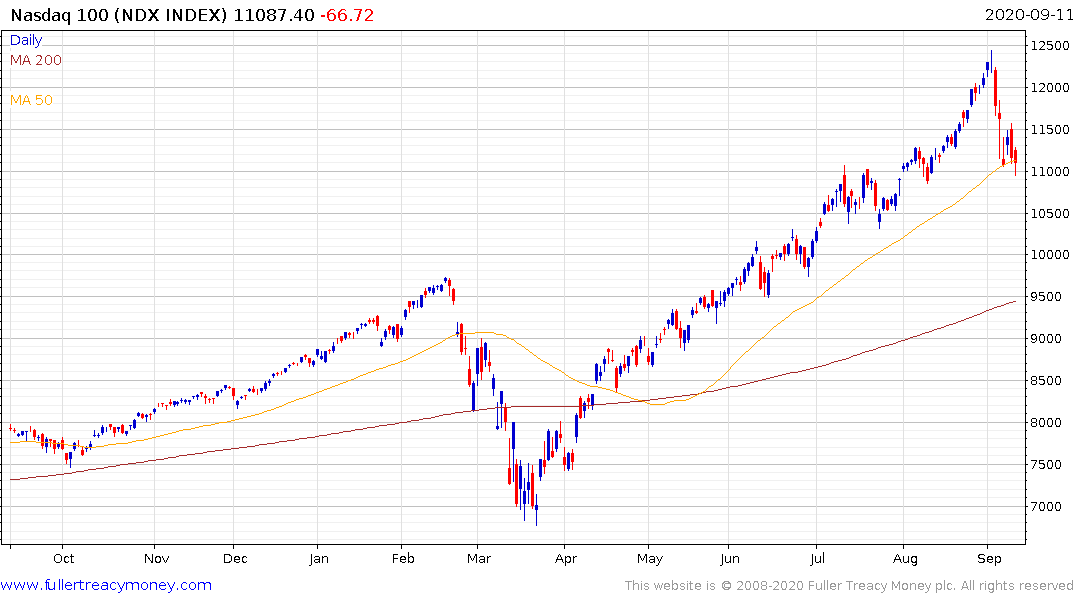
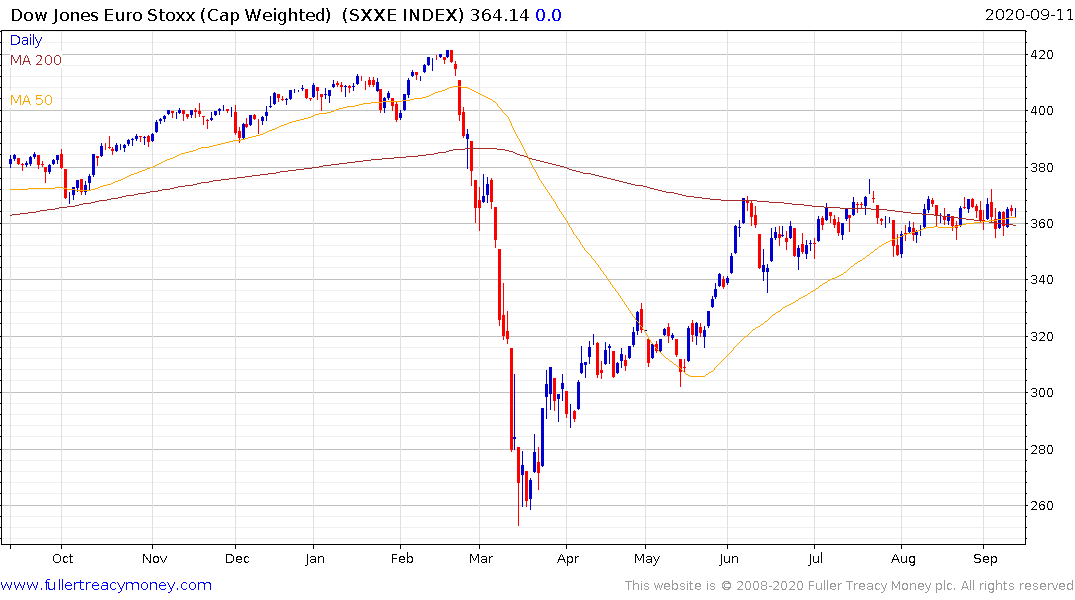
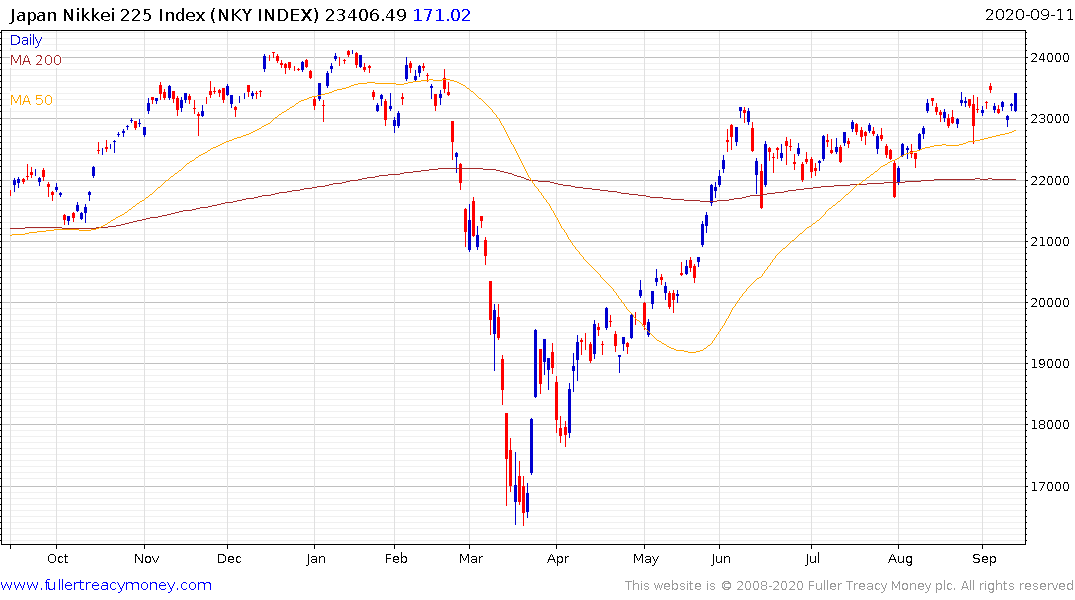
At present the S&P500, Nasdaq-100, Dow Jones Industrials Average, Russell 2000, German DAX, Japanese Nikkei-225 and Euro STOXX indices are all trading in the region of their respective 50-day moving averages. So is gold.
That commonality is suggestive of meaningful momentum over the last six months. The tendency of the market to bounce from these levels is also supportive of the dominance of leveraged investors in supporting the move. The clear conclusion is that if momentum is still dominant these levels will hold. If they fail the potential for a deeper reaction towards the 200-day MA will be more credible. That is particularly relevant a present as the technology sector continues to retrace its impressive recent outperformance
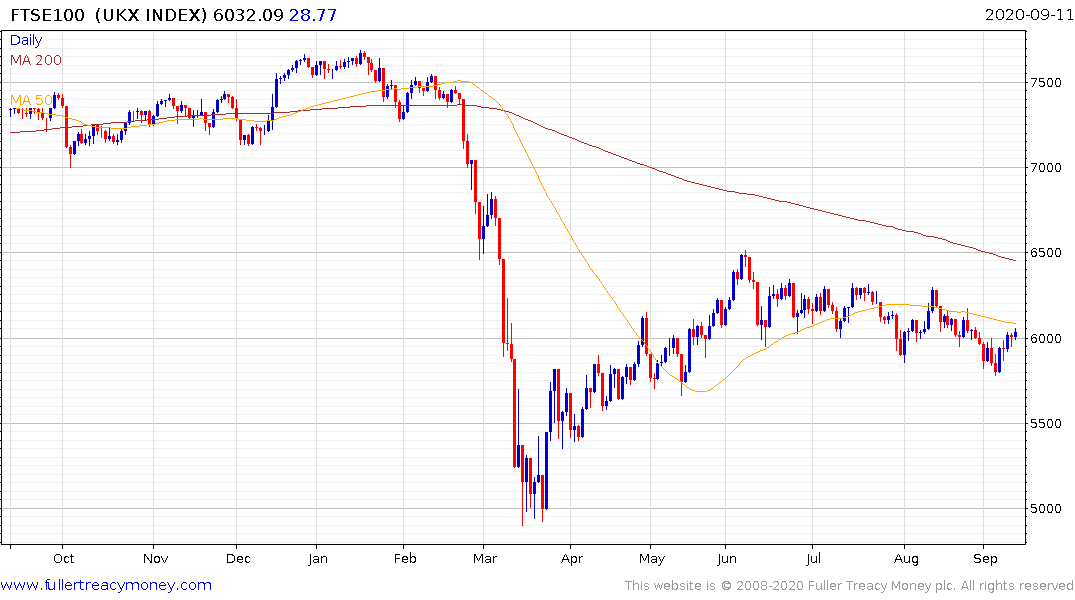
Meanwhile, the FTSE-100 have been encountering resistance in the region of the 50-day moving average which suggest investors are not willing to give the UK market the benefit of the doubt while Brexit brinksmanship hangs in the balance.
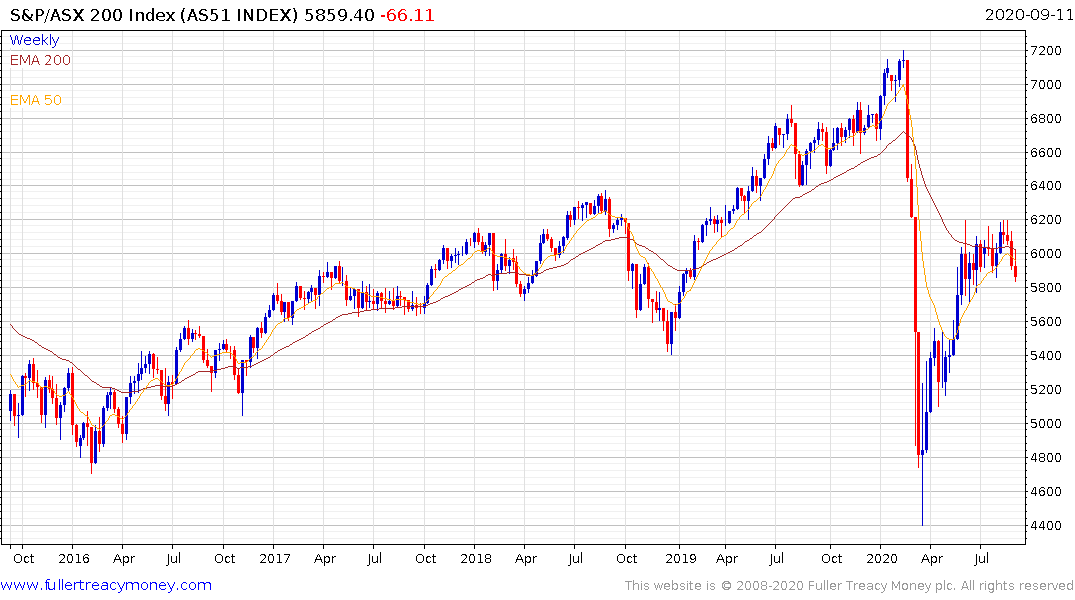
Australia's S&P/ASX 200 is also encountering resistance in the region of the 50-day MA
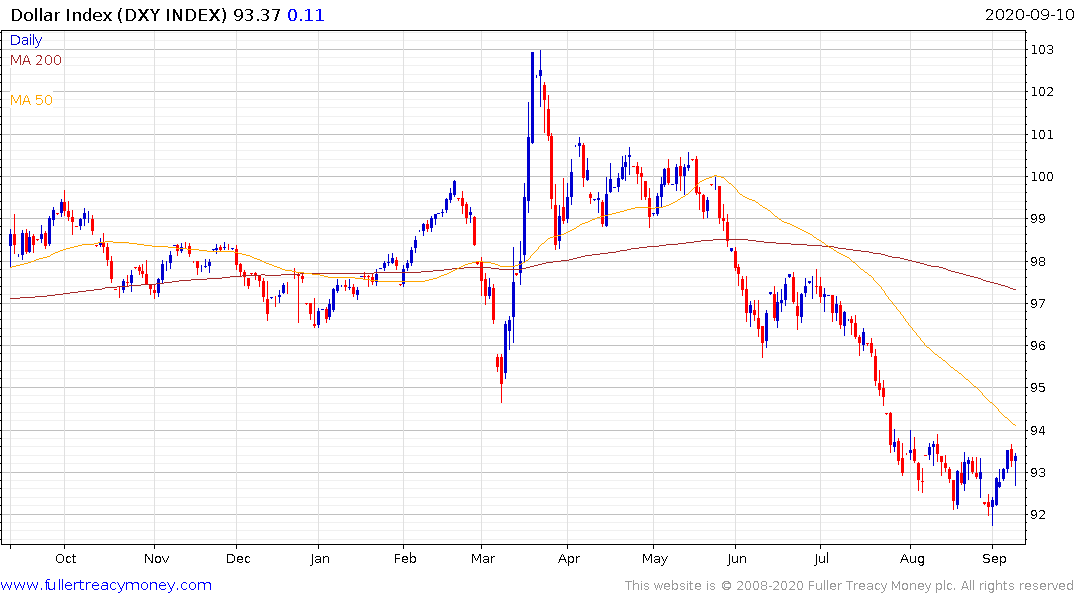
Leveraged traders thrive on liquidity. Right now, the flow of liquidity is in question which is a significant contributing factor in the reaction that began earlier this week. The Dollar’s decline and the flow of liquidity from monetary and fiscal authorities have all moderated. That is removing fuel from leveraged flows. The big question, therefore, is how much of a decline is required for central banks to intervene and start printing aggressively again? For the major indices, perhaps that is the 200-day MA rather than the 50-day.