
Fueling the Next Industrial Expansion
Thanks to a subscriber for this interesting report from Deutsche Bank focusing on natural gas demand growth. Here is a section:
Our bottom up analysis suggests US industrial demand is likely to assume a higher growth trajectory as new projects take hold beyond 2015. While we are wary of simply adding both our top down and bottom up approach to forecasting, the announced project backlog and the implied intensity of incremental natural gas demand is significantly ahead of consensus expectations. Our view is that some portion of the industrial projects is additive – not a substitute - to the baseload of US industrial natural gas use implied by a top down survey.
The EIA and Wood Mackenzie forecast US industrial demand growth for natural gas based on trend. The EIA annual energy outlook assumes 22.2 Bcf/d of 2018 demand (up 2.5 Bcf/d from 2012). Wood Mackenzie looks to add both a baseline of GDP driven growth (1.9 Bcf/d) and a similar project build-up adding 2.0 Bcf/d. We would also note Wood Mackenzie recently revised its total industrial demand estimates, with total 2018 industrial demand increasing from 22.7 Bcf/d (Fall 2013) to 23.6 Bcf/d, directionally in line with our work.
Our utilities equity research colleagues highlight the potential impact from the pending EPA ruling on carbon regulations for existing coal plants. Aggressive carbon reduction targets are expected, but mandating specific levels may prove difficult in light of the Clean Air Act limitations. We expect the result will be more demand side reductions and more natural gas burn in the power stack. While a potential positive for deferred natural gas, compliance is likely in the 2019-2030 timeframe.
?Our top down macro approach forecast based on a multi-variable regression model compares favorably with a 22.5 Bcf/d implied forecast by 2018, implying ~0.5 Bcf/d annual growth. At risk of double counting, we remain confident that little of the project based inflection in demand is included in the EIA estimates. We see the potential for 2.3 Bcf/d of incremental natural gas demand through 2018 based on our bottom up forecast. This demand is identifiable, risked, and promises to reach an inflection point by 2016. We believe that industrial demand is likely to find a balancing point between these our top down and bottom up approach, but above levels implied by major forecasting agencies such as the EIA.

Here is a link to the full report.
It has been our belief at FullerTreacyMoney since at least 2008 that unconventional oil and gas represent game-changers for the energy sector. The imposition of stringent environment standards on the coal burning sector represent an additional compelling demand driver. There is every reason to believe that the use of natural gas as a feedstock for utilities, industry, homes and transport is on a secular uptrend.
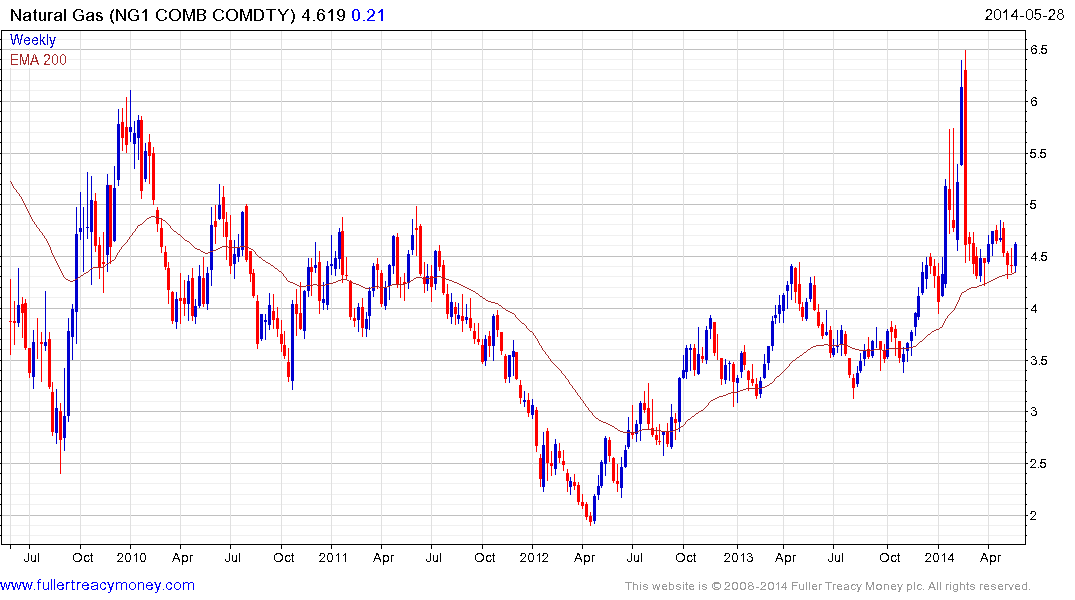
From a supply perspective, progressively more gas becomes economic the higher prices move and the last decade has demonstrated that there are ample sources of gas available for the right price. This suggests that while there is potential for occasional spikes higher, these are unlikely to be sustained beyond the short-term. Nevertheless, the $4 area probably represents a new floor for pricing because it is a breakeven for a great deal of unconventional supply. .
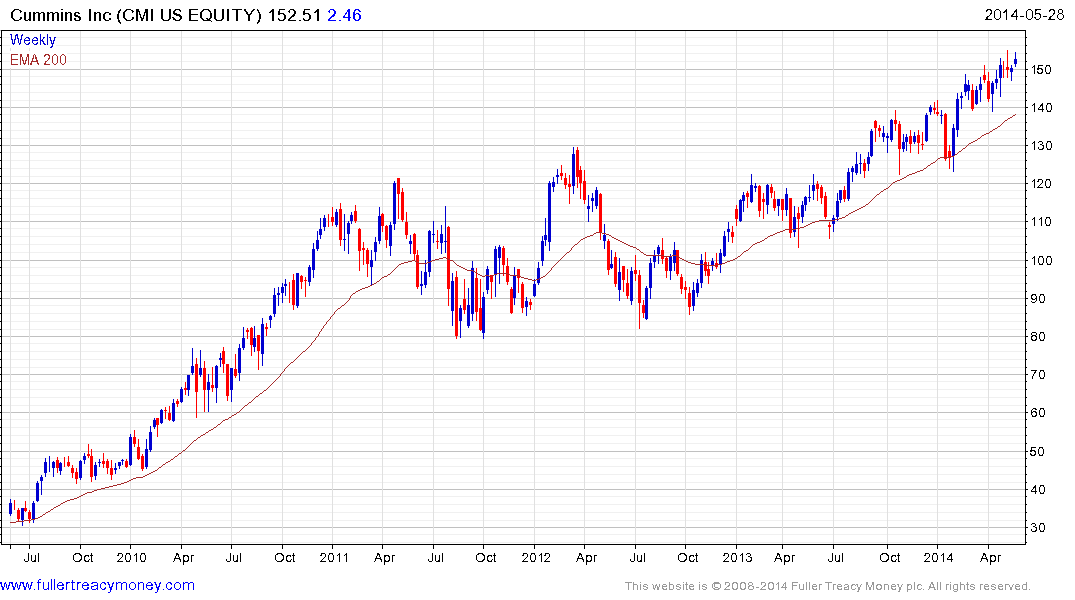
This is not a new story and a number of the shares which benefit from increased gas consumption have been trending higher for a while. For example Cummins (Est P/E 17, DY 1.64%) is trading around the same valuation as the wider market and is a leader in natural gas power trains. The share completed a two and half year range in August and continues to hold a progression of higher reaction lows.
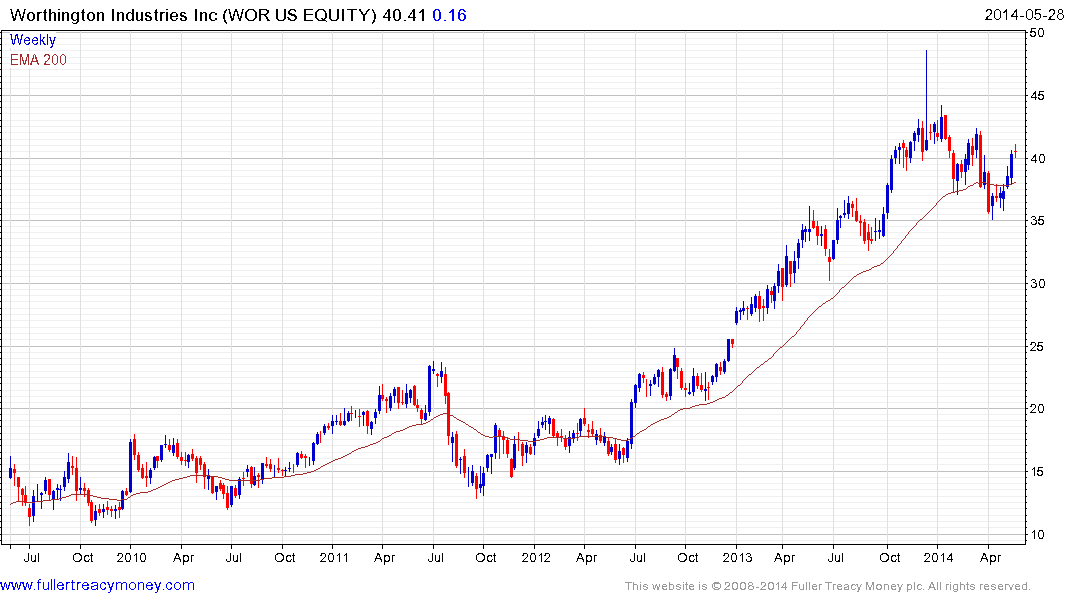
Worthington Industries (Est P/E 17.03, DY 1.49%) is one of the world’s leading manufacturers of pressurised steel containers. The share completed a decade long base in early 2013 and has been engaged in a process of mean reversion since late last year. It has rallied over the last couple of weeks to challenge the five-month progression of lower rally highs and will need to find support above $35 on the next pullback to indicate demand has returned to dominance beyond the short term.
Back to top