
Yields for stock market indices

David Fuller's view November has been a poor month for stock market indices, so far, with many giving
up a chunk of October's gains, and more in some instances, mainly within greater
Europe.
With
most commentators understandably focussing on Europe's sovereign debt crisis,
sentiment has deteriorated with each down day for stock markets. "No way
out" seems to be the prevailing view.
Can this
be true for a debt crisis? Yes, in theory, but veteran subscribers will have
observed that in markets the crowd's worst fears are seldom realised.
Discussing
this with Eoin this morning, he said: The time to discount worst case scenarios
is at the top of the market." In other words, when things seem almost too
good to be true, they probably are.
Since
it can be difficult to remain objective in an overextended bull trend, we need
factual technical criteria, which cannot be dismissed with fanciful interpretation.
The clearest and most timely technical evidence of risk in a maturing bull trend
will be a large overextension relative to the rising 200-day moving average,
signalling crowd euphoria.
Veteran
subscribers will have seen this on many occasions. When it next occurs, we need
to remember that wealth is realised in up markets.
More
recently, we have seen downside overextensions relative to declining 200-day
moving averages for many stock market indices, not least in early October. Those
were at least partially corrected by last month's powerful rally.
However,
this month's stock market decline is creating new oversold readings. We also
have rising yields which are at historically attractive levels for many indices.
They can become even more attractive in the event of another wave of panic selling
but those who wait for worst case scenarios to be realised miss out more often
than not. We need to remember that wealth is created in down markets.
Some
will argue that dividends are vulnerable during an economic decline. This is
true and among individual shares we need to be wary of the highest yields, especially
if those companies are largely dependent on revenue generated in a weak domestic
economy.
However,
rising corporate profits, not least for the successful Autonomies, shows that
many companies have adapted well to the slow growth environment in the west.
Eoin has frequently reviewed these companies and we will continue to like them
while their share prices trend to the left of rising 200-day moving averages.
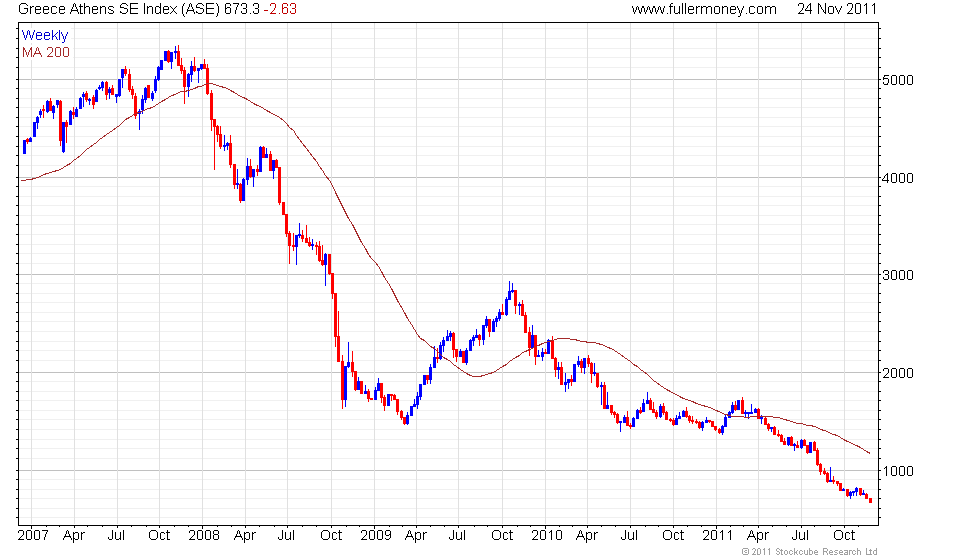
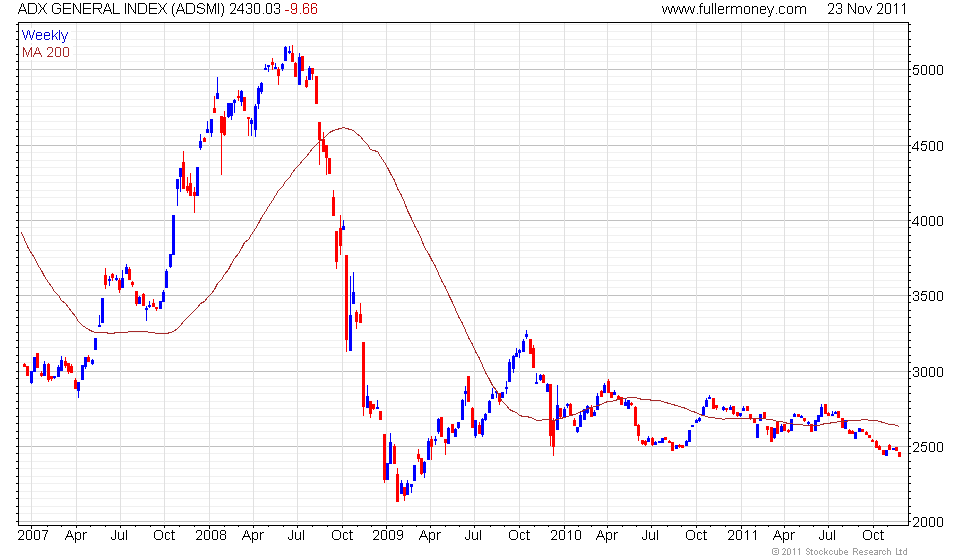
Meanwhile,
for price perspective relative to the MAs, plus current yields, here are the
main stock market indices for individual countries and territories:
Asia
- Pacific
Australia 5.00%, China
2.03%, Hong Kong 3.75%, India
1.60%, Indonesia 2.17%, Japan
2.68, Korea 1.59%, Malaysia
3.43%, Pakistan 6.15%, Philippines
3.36%, Singapore 4.12%, Taiwan
4.87%, Thailand 3.73% and Vietnam
4.84%.
Western
Europe
Austria 4.33%, Belgium
4.96%, France 5.27%, Germany
4.43%, Ireland 2.24%, Luxembourg
4.19%, Netherlands 4.25%, Switzerland
2.81% and United Kingdom 4.24%.
Northern
& Southern Europe
Denmark 1.50%, Finland
6.21%, Norway 5.74%, Sweden
4.75%, Cyprus 3.87%, Greece
4.79%, Italy 5.82%, Portugal
10.28 and Spain 6.20%.
Eastern
Europe
Croatia 4.14%, Czech
Republic 7.41%, Hungary 2.50%,
Poland 4.34%, Russia
2.45%, Slovenia 4.01% and Turkey
3.06%.
Middle
East & Africa
Bahrain 5.41%, Egypt
5.90%, Israel 4.08%, Kuwait
3.33%, Qatar 4.16%, Saudi
Arabia 3.64%, Abu Dhabi 4.17%, Botswana
5.85%, Kenya 5.85%, Nigeria
4.23% and South Africa 3.05%.
North
America
Canada 2.94% and United
States 2.27%.
Latin
America
Argentina 5.28%, Brazil
4.43%, Chile 2.8%, Colombia
2.42%, Mexico 1.49% and Peru
5.00%.
Conclusion
- The number of attractive yields available confirms
value in many stock markets and should help to cushion downside risk. However,
stock market indices are retreating beneath their top formations. While short-term
oversold conditions are evident, major stock markets led by the USA have yet
to confirm support from the September to early-October lows. This will require
clear upward dynamics and eventual breaks above the October to early-November
highs. Where indices have broken beneath the year's earlier lows - this is mainly
in Europe - downtrends have been reconfirmed and rebounds are required to question
trend consistency.
In other
words, it is still up to the bulls to prove that this cyclical bear market is
ending or over.