
Yield curve charts

At the Marcus Evans conference I attended at the beginning of this week one of the speakers, R. McFall Lamm, formerly chief strategist at Deutsche Asset Management and now at Stelac Private Equity made a couple of interesting points about the yield curve.
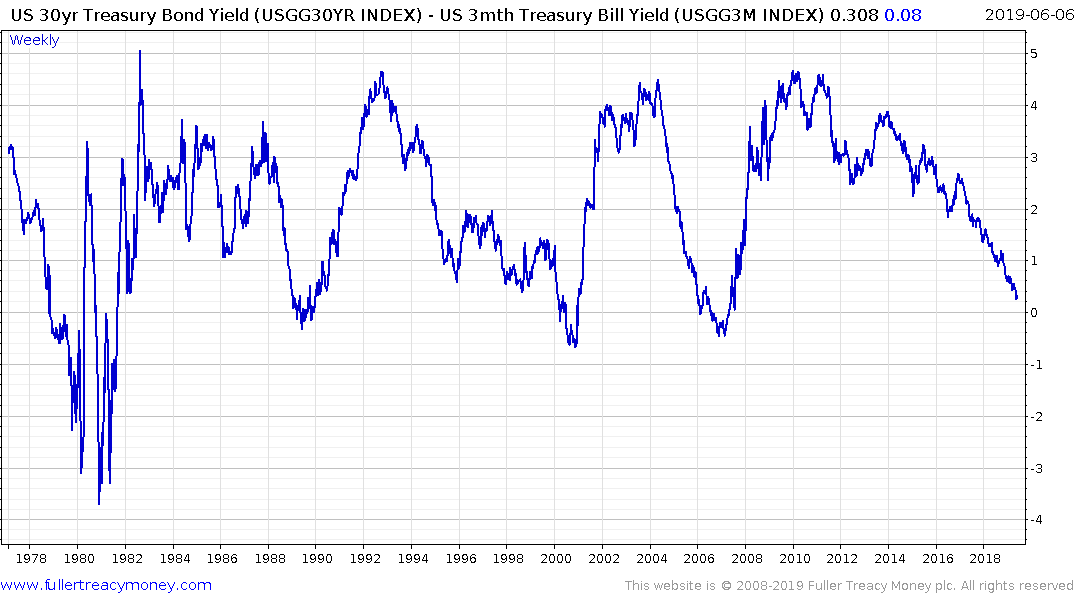
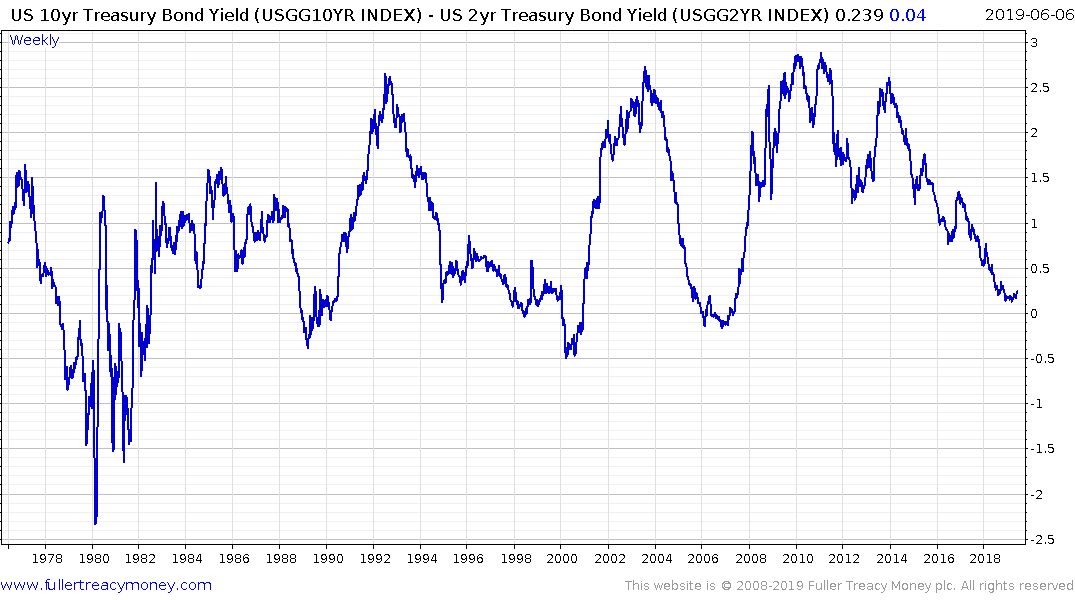
The first point was that he considers the 30-year - 3-month spread to have the best predicative ability. This is also something Leon Tuoy, who Jeffrey Saut routinely quotes, also talks about. By taking the longer spread there is certainly less noise but importantly neither the 30-year - 3-month spread nor the 10-year - 2-year spread have inverted.
The next point was the yield curve spread is at its most predictive when there is a confluence of signals with the Municipal, Investment Grade and High Yield. Right now, these additional measures are not inverted either.
The third point was that it is usually when the spreads start to widen again, following an inversion that we need to be most alert.
What these charts tell us is the USA is close to recession inducing monetary conditions, but if the monetary assistance the bond market is predicting is provided a recession can be avoided. That suggests there is scope or another significant up-leg in stock markets before monetary tightening again becomes a talking point.