
World Equity Market Valuations Tables
I posted the last edition of this table in September before our transition to the new site infrastructure and am happy to reintroduce it now

On this occasion valuations for 99 globally significant indices from January 6th are depicted in the left hand set of columns and today’s values can be found in the right-hand set of columns.
While there has been a great deal of volatility on global markets over the same timeframe, valuations have been relatively static. However when we take currency market volatility into account, a truer picture of performance is revealed. Argentina and Russia may have low valuations but their currencies have also been the worst performing this year.
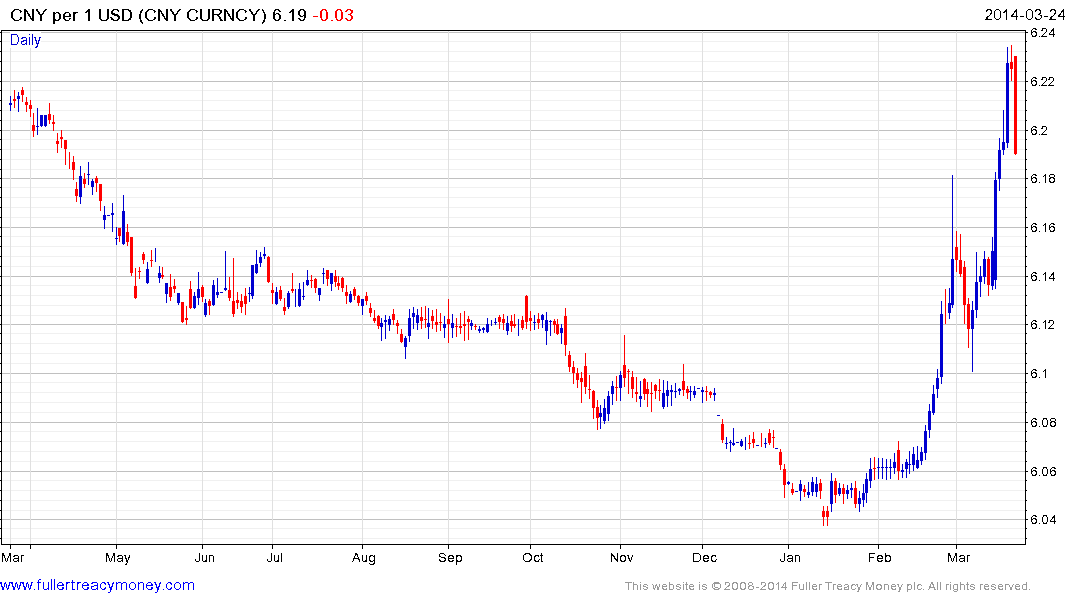
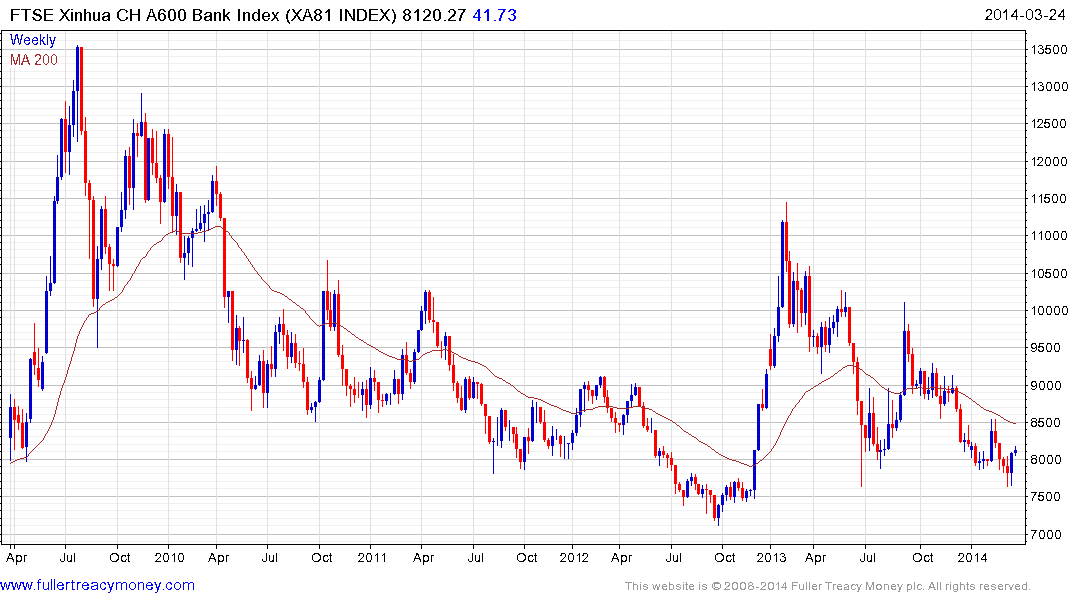
For the first time in twenty years the performance of the Chinese Renminbi is negative year-to-data and Chinese stock market indices dominate the list in terms both of low P/Es and high dividends. The Renminbi found at least short-term support today but the likelihood remains that the medium-term uptrend is over. The announcement on Friday that a market for preferred shares will be created was positive for the banking sector but a break in the medium-term progression of lower rally highs will be required to signal a return to demand dominance beyond the short-term.
(Please note: All data quoted above originates in Bloomberg. We realise that some of the data displayed is inaccurate for some indices, particularly where ADRs are included. However, I have endeavoured to remove the most problematic indices. We publish these tables because the data is generally accurate and going forward we will continue to weed-out the less reliable data sets as subscribers highlight them for us. The P/Es quoted by Bloomberg are exclusively based on operating earnings.)