
Why High-Flying U.S. Home Prices Are About to Get Another Jolt
This article by Vince Golle for Bloomberg may be of interest to subscribers. Here is a section:
The framing of homes, or putting up roofs and walls, accounts for 15 percent of the cost of construction. A composite measure of the cost of lumber for framing rose 16 percent from December to March, according to data from Random Lengths, a publisher of information on wood products.
And it’s not just lumber. A Labor Department gauge of prices paid at the producer level for construction inputs -- everything from particleboard and plumbing to concrete and insulation -- was up 5.1 percent in March from a year earlier, the biggest annual advance in nearly eight years.
So far, neither higher home prices or a four-year high in mortgage costs have been enough to dissuade buyers. Results of the Conference Board’s consumer confidence index on Tuesday showed 1.7 percent of the group’s respondents in April planned to purchase a new home in the next six months, matching the highest share in this expansion.

The falling cost of mobile phone tariffs are what helped to keep inflationary pressures under wraps last year. However, that effect will fall off the gauge for the March reading which will be released on May 1st. Meanwhile, the range of new inflationary pressures on the horizon continue to increase.
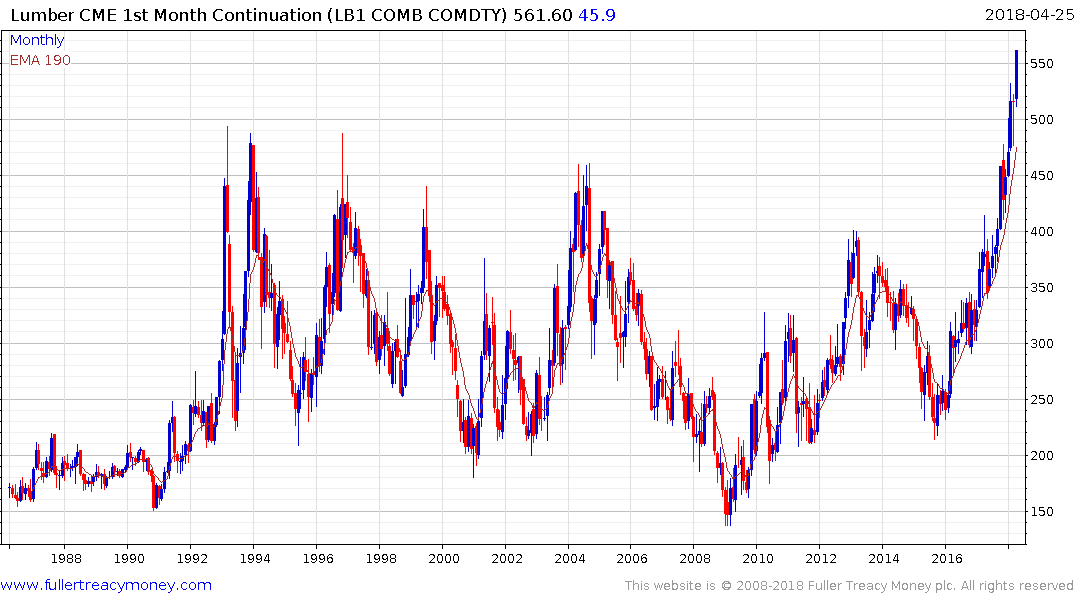
Lumber has historically been a highly volatile commodity but it is now at all-time highs and has broken out of a 25-year range; more than doubling from the 2015 lows in the process.
Back in the 1980s $200 represented an area of resistance but once a sustained breakout was attained that level represented an area of support. It is still early in this inflationary cycle but it will be educative to find out whether the $400 area will represent an area of support in future.
.png)
US Treasury yields extended the move above 3% today. When we were redesigning the Chart Library, a number of our most successful subscribers mentioned that they often had some of their best calls when they looked at the mirror image of a chart. It is sometimes difficult to identify tops so by looking at the inverse we can ask whether it looks like a good buy?
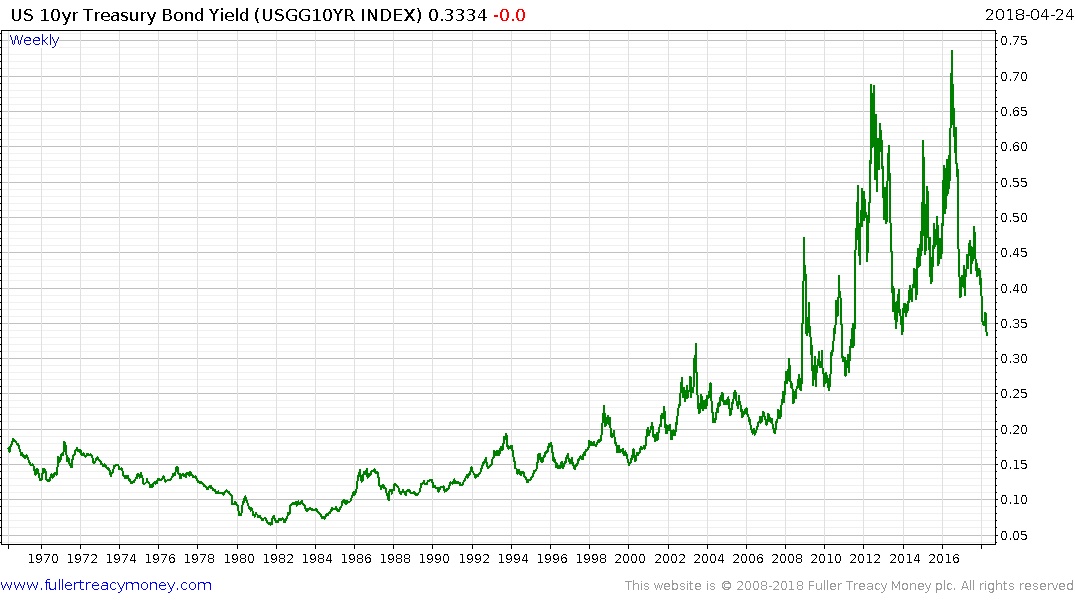
We added that function to the Library as a result. When we look at the inverse of the 10-year yield we get a very interesting chart. It clearly highlights the scale of the intervention pioneered by the Federal Reserve and the progression of higher reaction lows evident since 1981 has conclusively been broken.
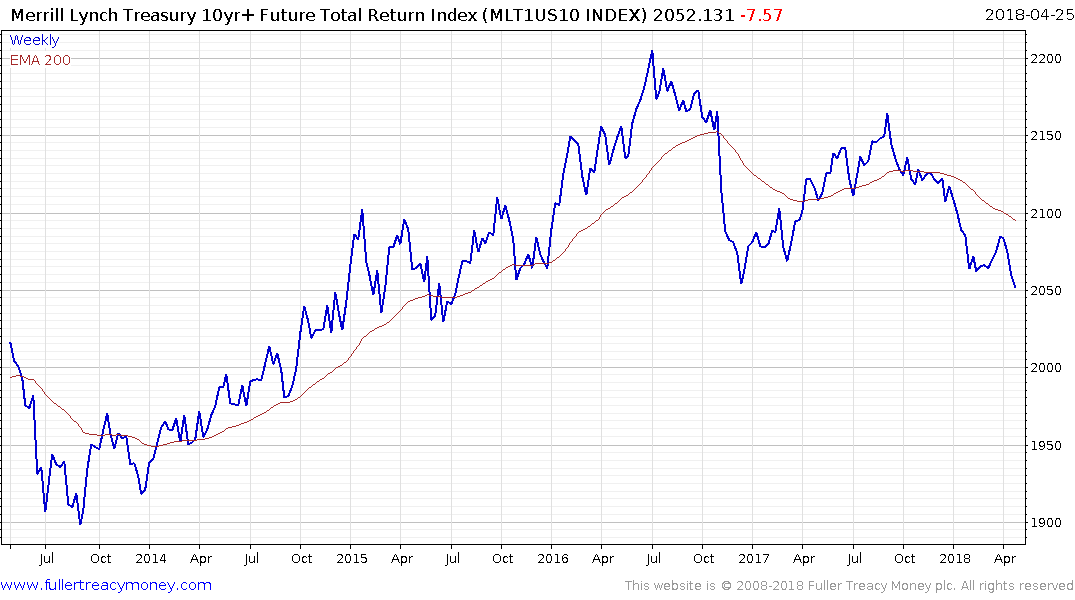
When we look at the Merrill Lynch 10-year Futures Total Return Index we have evidence of Type-3 top formation completion.
The surge in supply of bonds is occurring at the same time that inflationary pressures are mounting. If this were a commodity market we would be talking about a triple waterfall event with yields rising. In addition to those facts, we have to remember that ranges are explosions waiting to happen. Now that the 3% level has been broken through, there is ample scope for a further run-up in yields.
That represents a challenge for the stock market. There are plenty of companies with solid free cash flow yields. However, for those that relied on leverage or valuation expansion to justify higher prices, higher yields represent a challenge to the relative value argument. The logic for justifying high nominal valuations was based on low interest rates, with higher yields that argument is now a lot less compelling.
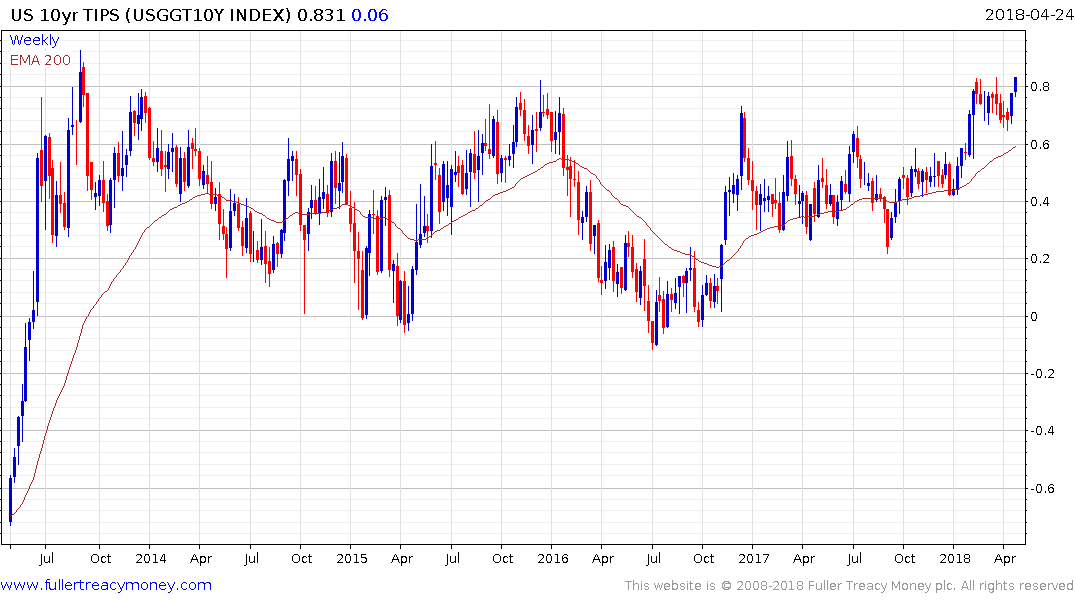
10-year TIPS appear to be in the process of completing a multi-year range which can be seen as further evidence investors believe inflationary pressures are rising.
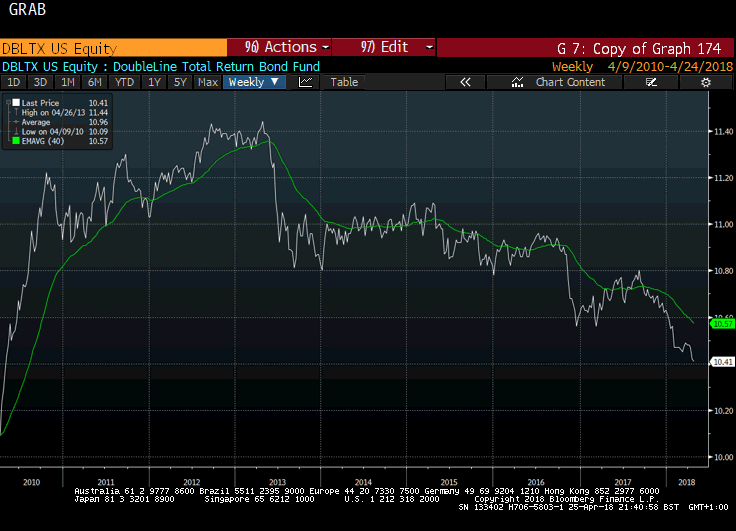
The DoubleLine Total Return Bond Fund, with $50 billion under management, remains in a consistent medium-term downtrend and might be viewed as a barometer for the performance of bond funds generally.
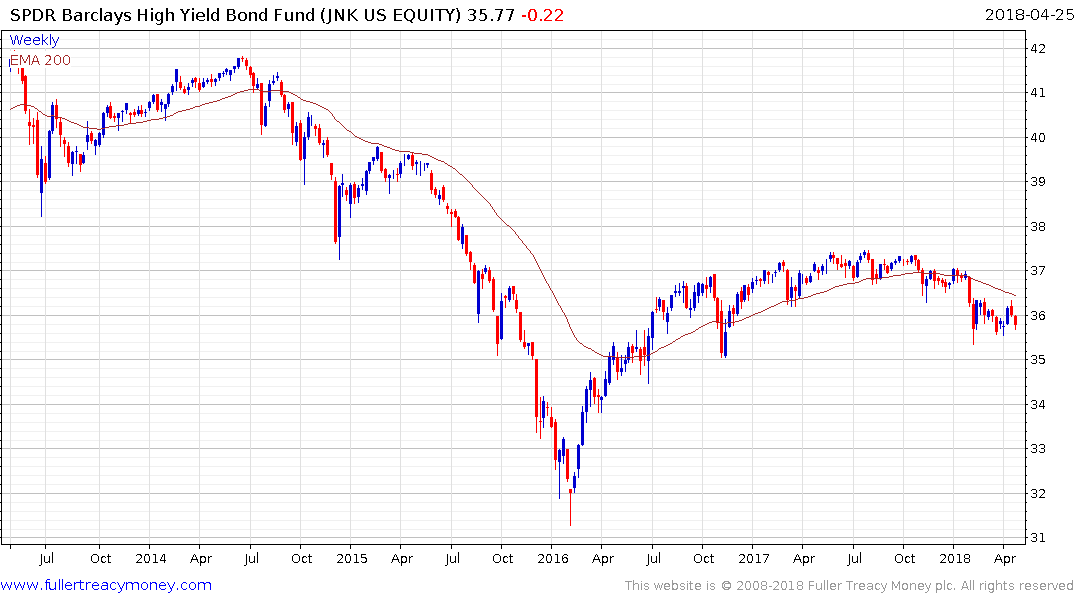
The SPDR Bloomberg Barclays High Yield Bond ETF continues to roll over.
One of the issues many investors and investment advisors have is all the financial literature states bonds represent a source of stability in a portfolio that compensates for the volatility of equities. That view was formulated during one of the longest bull markets in history, it takes now account of a bond bear market.
Back to top