
U.S. Corporate Profits on Pace for Third Straight Decline
This article by Theo Francis for the Wall Street Journal may be of interest to subscribers. Here is a section:
P&G has trimmed its predictions for overall growth in its markets to about 3% world-wide this fiscal year, down from earlier projections as high as 4%. More than 10% of sales at P&G come from tumultuous regions, like Russia, Ukraine, the Middle East, Turkey, Brazil and other parts of Latin America, Chief Financial Officer Jon Moeller said in the company’s Tuesday earnings call.
“There are more flashpoints across the globe than at any time in recent memory with significant economic and political instability impacting incomes and consumption in many large and important markets,” he said.
Ultimately, despite the resilience of the U.S. consumer, economic growth is likely to remain sluggish given continuing woes in emerging markets, sizable inventories, a still-strong dollar and still-weak capital investment, says Joseph LaVorgna, chief U.S. economist for Deutsche Bank.
“It’ll be hard to get a whole lot of corporate profit growth,” Mr. LaVorgna said. “It’s hard to get really bullish.”

Bloomberg listed the date for the latest data point on the Bureau of Economic Affairs Corporate Profits chart as April 28th but that changed overnight to May 28th and from what I can see it is updated quarterly in arrears so it is more likely that we will get the data point for the first quarter at end of June. Nevertheless from the below chart a loss of momentum is evident since the end of 2014 and while profits are still close to record highs the outlook for continued expansion is waning.
Against that background the ability of major stock indices to extend moves to new highs is dependent on valuation expansion. However liquidity is a big part of the fuel for momentum trades and the wariness of investors for stocks, when profits are declining on aggregate, means the role of liquidity expansion plays an even greater role in enabling momentum moves.
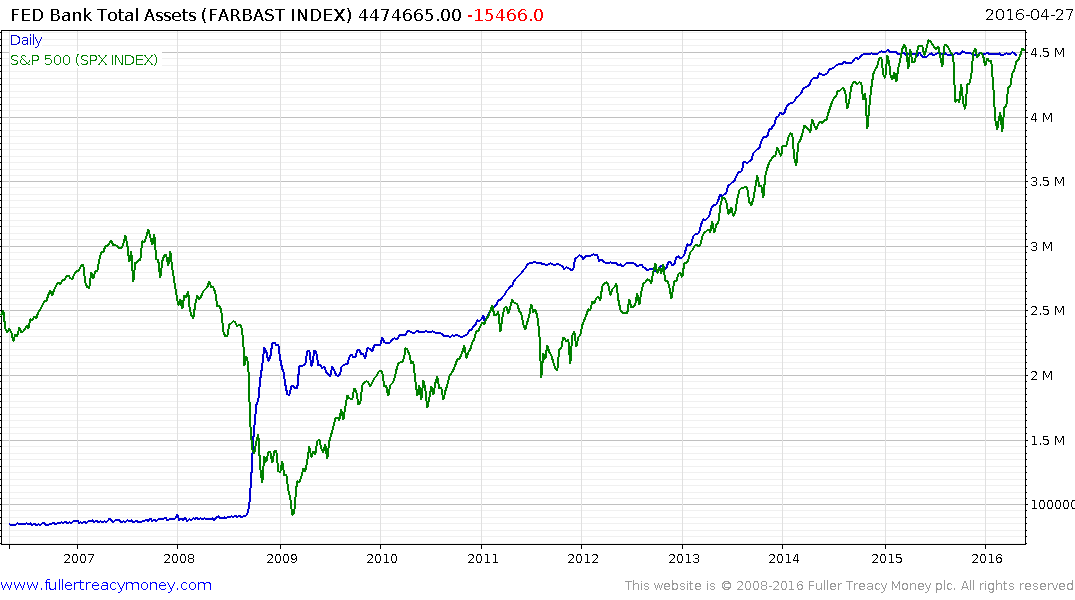
The Fed’s balance sheet stopped expanding in late 2014 and the S&P500 is trading around the same level today as it did back then. That is why so much attention is focused on what the Fed is likely to do because the quantity of money is now longer expanding and expectations are for interest rates to rise over time which represents a headwind for highly leveraged traders.
This article from McKinsey discussing the influence low interest rates, low inflation and abundant liquidity has had on profits may also be of interest. Here is a section:
These returns were driven by an extraordinary confluence of favorable economic and business fundamentals. Inflation and interest rates declined sharply from peaks in the late 1970s and 1980s. Global economic growth was strong, fueled by positive demographics, productivity gains, and rapid growth in China. And corporate-profit growth was even stronger, reflecting revenue gains in new markets, declining corporate taxes, and advances in automation and global supply chains that helped rein in costs. Publicly listed North American companies alone increased their post-tax margins by 65 percent in this three-decade period.
This golden era has now ended. A new McKinsey Global Institute (MGI) report, Diminishing returns: Why investors may need to lower their expectations, finds that the forces that have driven exceptional returns are weakening, and in some cases reversing. The big decline in interest rates and inflation is reaching its limits, global GDP growth will be lower as populations in the developed world and China age, and the outlook for corporate profits is cloudier. While digitization and disruptive technologies could boost margins for some companies, the big North American and Western European firms that took the largest share of the global profit pool in the past 30 years face new competitive pressures from emerging-market companies, technology giants, and digital platform-enabled smaller rivals. These forces may curtail margins going forward.
We could have a long conversation about the outlook for valuations or monetary policy so perhaps we should simply concentrate on the facts represented by the price action.
.png)
The S&P 500 has been ranging for 18 months and that follows a particularly consistent medium-term uptrend. In the most basic terms that tells us the imbalance between supply and demand that drove the 2012-2014 advance is no longer in evidence. That is a piece of intelligence we cannot simply ignore. A new or renewed source of demand will be required to sustain an upside breakout. If we explore the bearish argument it is simply that people with long positions represent potential supply and have so far lacked an incentive to liquidate positions. The large downward dynamics in August 2015 and January of this year were much larger and swifter than the previous advances. Those kinds of moves are debilitating to sentiment and embolden short sellers.
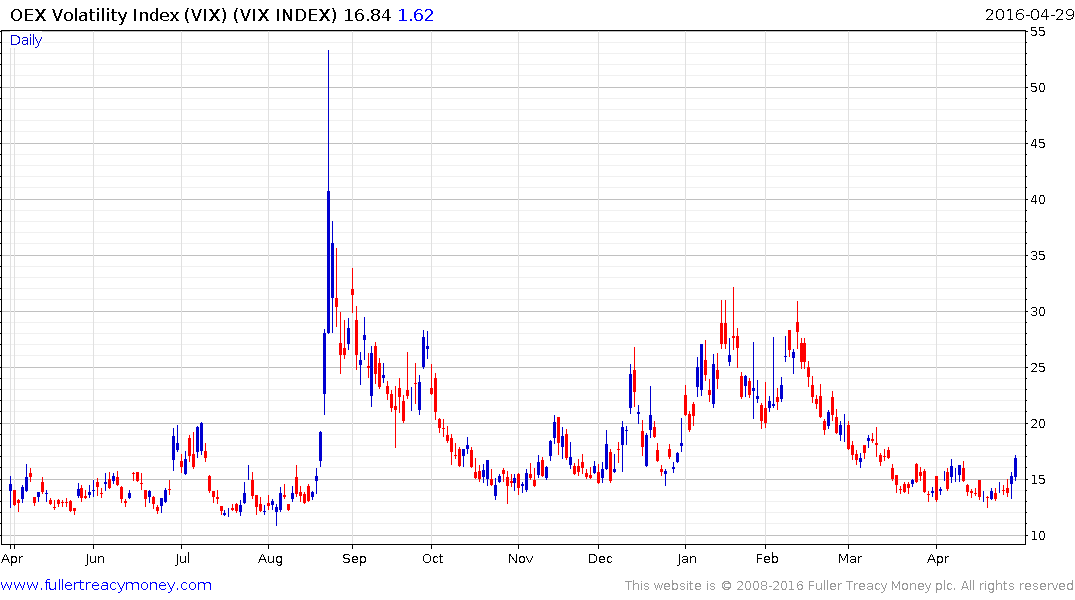
Single stock volatility has increased substantially during this earnings season but the net effect on the broad VIX Index has until today been relatively muted. Nevertheless, the potential for VIX to rise from current levels appears more likely than not. That is a major consideration for quantitative programs because it represents a major component in how they size positions. If the VIX rises, long funds need to reduce positions but short funds increase positions.
Right now the S&P is trading towards the upper side of its medium-term trading range so there is scope for it to trade back towards the lower of that range if a corrective environment unfolds as overbought condition following the 10-week rally from the January lows unwinds.
.png)
The Nasdaq-100 is leading on the downside. It has now posted a lower high and broken the progression of higher reaction lows from the January lows. Looking at the medium-term chart this is the first big consolidation following a particularly impressive rally how it could also be a developing type-3 top. A sustained move below 4000 would confirm that view.