
Trade Not the Only Risk; Markets Agree Adjusted Yield Curve Is Inverted; Higher Volatility Is Coming
Thanks to a subscriber for this report from Morgan Stanley. Here is a section:

Here is a link to the full report and here is a section from it:
While it’s difficult to see on the chart, the adjusted yield curve inverted last November and has remained in negative territory ever since, surpassing the minimum time required for a valid meaningful economic slowdown signal. It also suggests the "shot clock" started 6 months ago, putting us “in the zone” for a recession watch. We think the bond market has it right to suggest the next move for the Fed will be a cut. We also think the equity market has it right given how defensively it has traded since last summer (Exhibit 4). Furthermore, the curve inverted about the same time the trade truce happened in late November and has stayed inverted despite all the positive rhetoric earlier this year around a trade deal. We think this means the US economic slowdown and rising recession risk is happening regardless of the trade outcome.
Whether or not an economic recession occurs in the US in the near term may not be the most important signal from the yield curve for investors. We’ve shown the relationship between the yield curve and the VIX in past notes (Exhibit 5). As you can see, the yield curve has done a remarkably good job of forecasting the direction of the VIX 3 years in advance until recently when it appears to have not predicted the severe decline in the VIX a few years ago. However, if we use the adjusted yield curve, its predictive power remains very much intact. We take this to mean two things: First, our adjusted yield curve is likely right and second, investors need to get ready for a potentially much higher level of equity volatility in the near term and on a sustained basis.
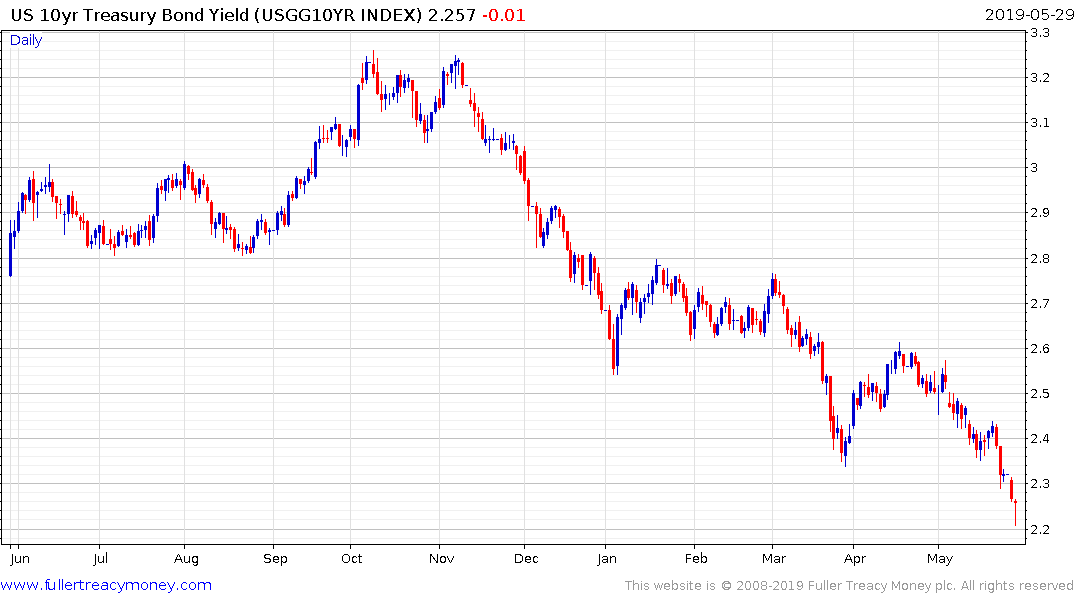
The commonality in the compression of global sovereign yields is a clear sign bond investors, everywhere, have concluded we are at the top of the interest rate cycle. If interest rates are unlikely to rise, they can fall and the big question is when that is likely to happen.
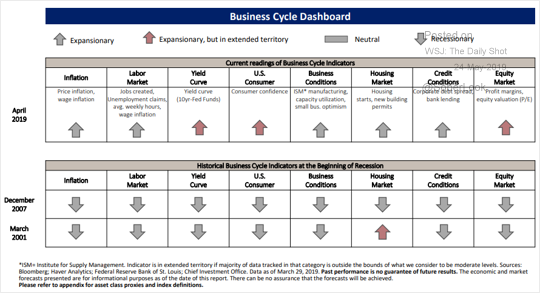
This graphic from Merrill Lynch highlights some of the factors that generally begin to deteriorate ahead of a recession or at least coincide with one beginning. Right now, none are flashing red but some are beginning to be of concern which supports the late cycle hypothesis.
The outperformance of bond proxies like Dividend Aristocrats, Utilities and Consumer Staples and high margin tech companies which have adopted subscription business models is further evidence to support that conclusion. However, all are now subject to some consolidation of recent gains.
My chart of the total assets sitting on central bank balance sheets made new lows two weeks ago and it continues to trend lower. That suggests tightening global liquidity which is not great news for asset prices.
Turning to Morgan Stanley’s interpretation of the yield curve. The yield curve has a significant trough with everything up to 12-month maturities yielding more than the 2,5,7 and 10-year maturities. The swap curve has a similar trough around the 2-year maturity. A flat yield curve is an inhibitor to credit growth. I have some sympathy with Morgan Stanley’s view that an adjustment factor for the effect of quantitative easing/tightening makes sense and the fact it is inverted is worth paying attention to. The downtrend in PMI indices is an additional cause for concern.
The signal coming from the bond markets is the Fed needs to cut rates now if they are to avoid a recession. The longer they wait the bigger the growth scare is likely to be and the delayed effect of monetary easing means they will have to cut more to have the desired outcome.
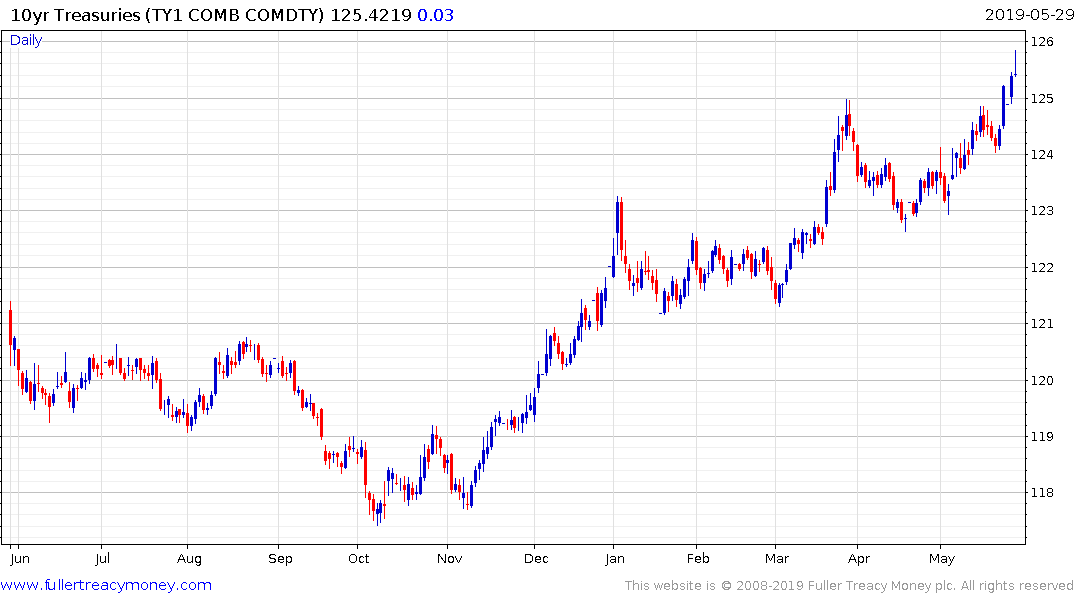
Meanwhile today’s disappointing auction of 7-year bonds highlights the fact that supply concerns still have potential to influence buyer decisions. That suggests investors are alert to concerns about US growth which could influence the ability of the government to fund itself. If we think about what the possible catalysts are for a growth scare, they reside in China, Europe (Italy) and the USA’s bond market in that order.
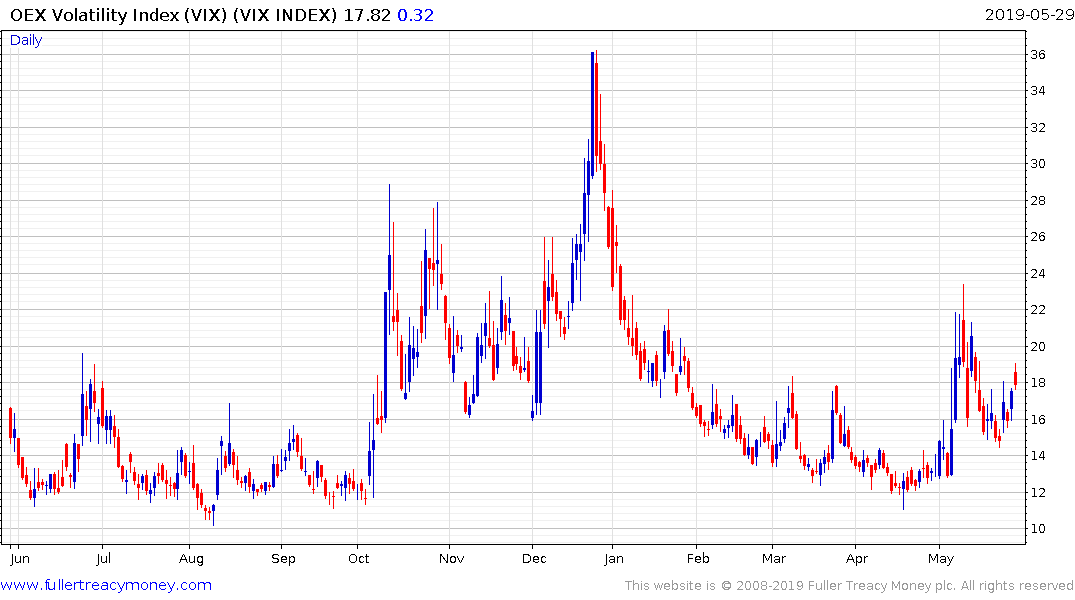
The VIX Index I stabilising above 15, suggesting a return to low volatility is unlikely.
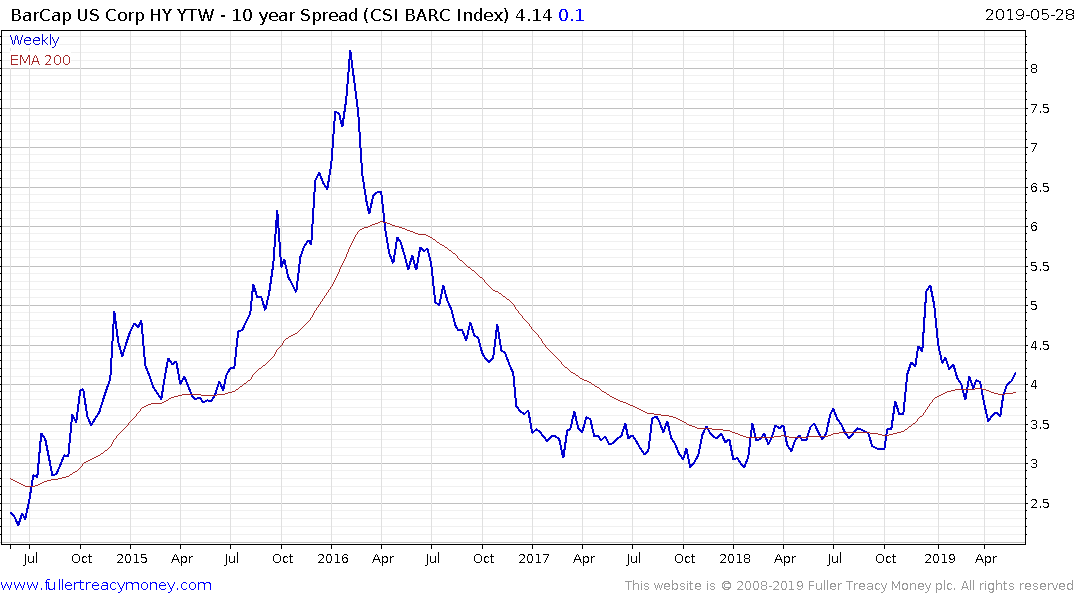
High Yield spreads pushed back above the trend mean this week, in a manner similar to the consolidation that presaged the spike higher in late 2015.
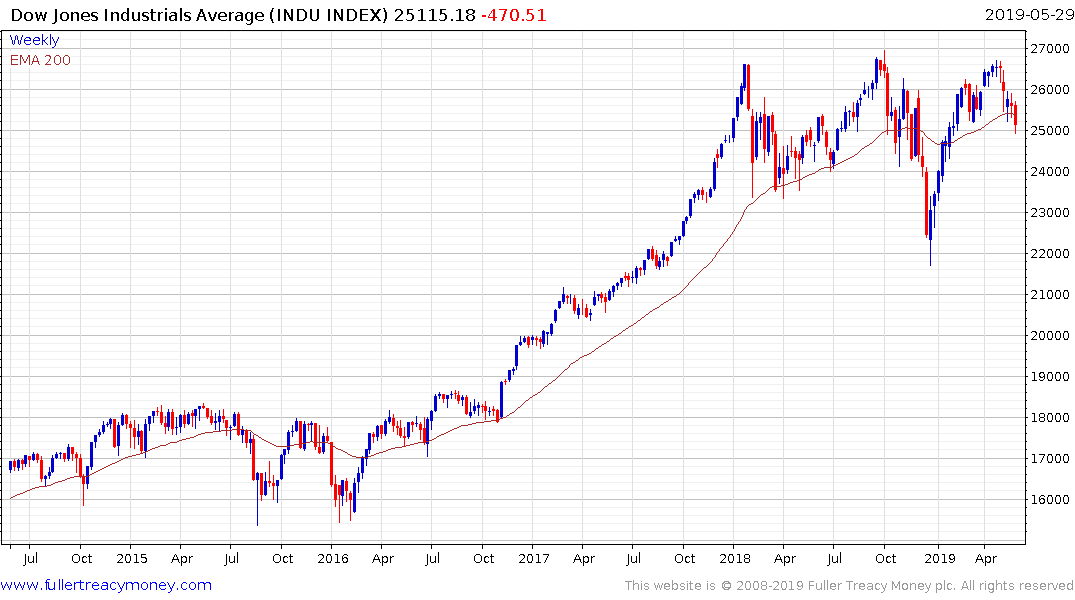
The Dow Jones Industrials Average broke downwards from its four-month range today but closed well off its lows. It is going to have to pop back up into the range over coming days to signal a return to demand dominance.
The key test of the rebound that began on Wall Street on Boxing Day is the extent to which major indices can hold 50% of their gains.
The big conclusion is this is the point in the cycle to be most diligent with stops. When there is clear evidence of a stock one owns rolling over, against a tightening global liquidity environment, where there is potential for centrals banks to wait too long to ease, it is time to raise cash. Resistance being encountered in the region of the trend mean is clear bearish sign and is something to be particularly wary of.
Back to top