
Today's interesting charts

David Fuller's view Price
charts enable you to see the world's money flows.
USD/JPY
(weekly & daily)
completed its recent consolidation by breaking above the psychologically ¥100
level and extending those gains today. This confirms that the BoJ's policy of
devaluing the yen remains on track and a close beneath ¥98 would be required
to offset higher scope by signalling an upside failure. (See also Wednesday's
comment in this section.)
US
30-year T-Bonds (weekly & daily)
are extending the decline signalled by last week's downside key day reversal,
mostly formed by the downward dynamic on 3rd May. A close above 150 would be
required to offset current scope for further weakness, and instead, signal a
challenge of last year's highs.
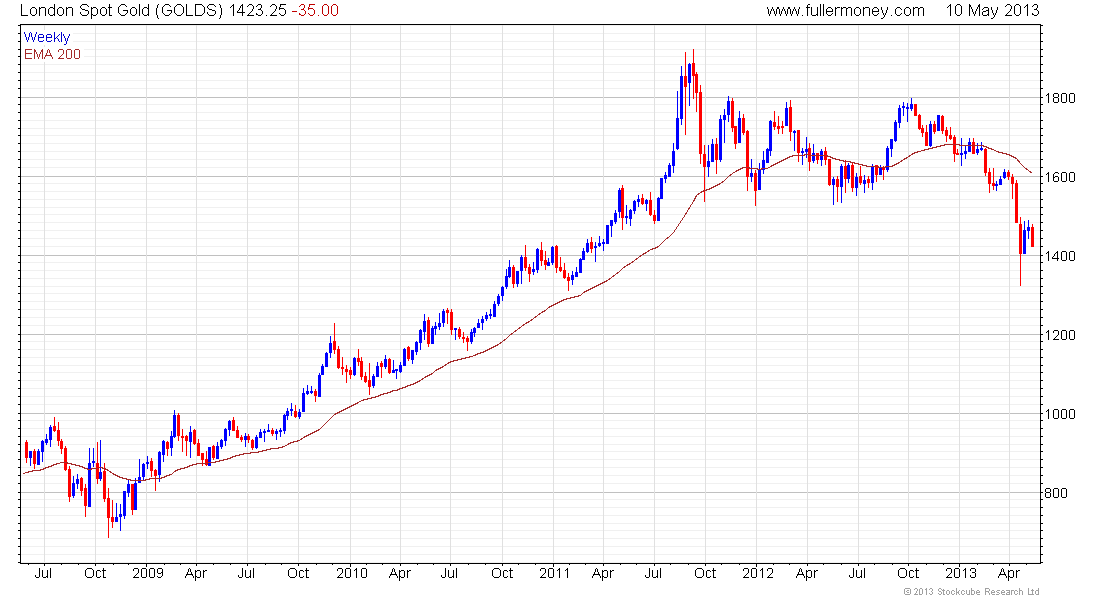
Gold
in USD (10-yr Semi-log, weekly
& daily) lost upside momentum beneath
overhead trading, following a good rally but which only managed to recover the
second day of climactic selling on 15th April. A rally back above $1465 is now
required to offset current scope for a further retracement of earlier rally
gains. Moreover a close above $1500 is needed to signal scope for a test of
extensive overhead trading. As a 'rule of thumb', the more a rally off a low
is retraced, the more likely at least a retest of that low becomes. Conversely,
markets in dynamic recovery mode hold most of their rally gains during consolidations.