
Today's interesting charts

David Fuller's view Price action is a useful reality check.
China's Shanghai A-Shares (weekly & daily) have seen upward momentum slow but an eventual break in the progression of higher reaction lows, with the most recent at 2340, will be necessary to check the ranging upward trend beyond a brief pause.
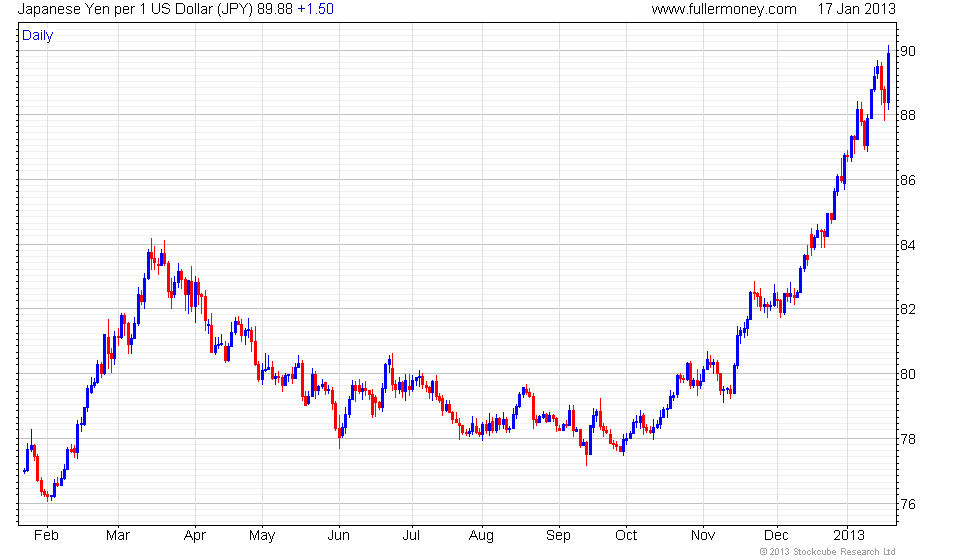
Japan's Nikkei 225 (weekly & daily) has also seen upward momentum slow and is more overextended, but a close below 10,400 would be required to check the now ranging upward bias. That may not occur until the USD/JPY breaks its progression of higher reaction lows.
India's Sensex (weekly & daily) continues to range higher and is now testing former resistance from above the psychological 20,000 level, plus the former highs (partially shown) in 2007 and 2010. However, it is also doing so from a higher starting platform of support and a break in the progression rising lows, with the last at 19,600, is required to interrupt overall uptrend consistency.
Australia's AS51 (weekly & daily) has seen its upward momentum slow in recent weeks following the strong rally since mid-November. However, a close beneath 4690 would be required to suggest more than a brief pause.
The UK's FTSE 100 (weekly & daily) is pushing above the higher side of its range since 2011 and a clear downward dynamic would be required to check current upward momentum.
The US's S&P 500 (weekly & daily) has pushed above last year's highs and a close beneath 1450 would be required to indicate an upside failure and further delay a test of the 2007 peaks.