
Today's interesting charts

David Fuller's view Mexico's MEXBOL (weekly & daily) has been building support since its climactic August low and it is now breaking above range highs since November. Above its rising 200-day MA and currently one of the world's strongest stock markets, a close beneath 36,400 would now be required to question current scope for at least a test of the January 2011 all-time peak.
Brazil's IBOV (weekly & daily) is extending its break above the important lateral and psychological 60,000 level and the MA is beginning to turn upwards. A sustained move back beneath this level would be required to question current potential for sideways to higher ranging in a further test of the 2008 to 2011 top areas.
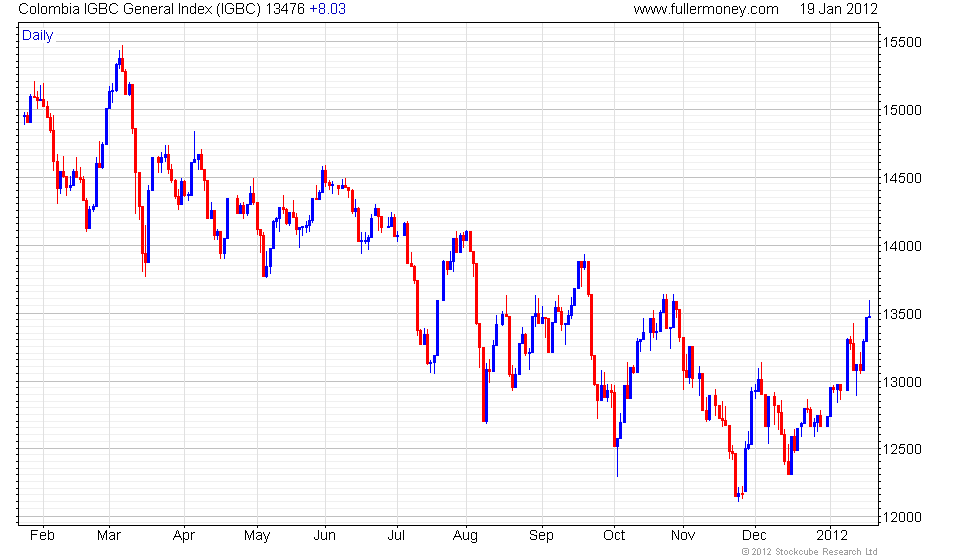
Colombia's IGBC (weekly & daily) has seen one of its best rallies since the 2010 peak. It is challenging the MA and appears to have broken the medium-term downward trend. A close beneath 13,000 would now be needed to question potential for additional sideways to higher ranging.
Peru's IGBVL (weekly & daily) has been rising since yearend, taking out highs since last September in the process. While somewhat overextended in the short term and susceptible to a reaction and consolidation of recent gains, a close beneath 20,000 would be needed to question medium-term scope for additional gains.
Switzerland's SMI (weekly & daily) pushed above its MA last month, consolidated near the psychological 6000 level and has resumed its recovery this week. A close beneath 5960 would be needed to check upward momentum beyond a brief pause.