
To Help Put Recent Economic & Market Moves in Perspective
Thanks to a subscriber for this note from Ray Dalio which may be of interest to subscribers. Here is a section:
For all of the previously described reasons, the period that we are now in looks a lot like 1937.
Tightenings never work perfectly, so downturns follow. They are more difficult to reverse in the late stage of the long-term debt cycle because the abilities of central banks to lower interest rates and buy and push up financial assets are then limited. When they can’t do that anymore, there is the end of the long-term debt cycle. The proximity to the end can be measured by a) the proximity of interest rates to zero and b) the amount of remaining capacity of central banks to print money and buy assets and the capacity of these assets to rise in price.
The limitation in the ability to print money and make purchases typically comes about when a) asset prices rise to levels that lower the expected returns of these assets relative to the expected return of cash, b) central banks have bought such a large percentage of what there was to sell that buying more is difficult, or c) political obstacles stand in the way of buying more. We call the power of central banks to stimulate money and credit growth in these ways “the amount of fuel in the tank.” Right now, the world’s major central banks have the least fuel in their tanks since the late 1930s so are now in the later stages of the long-term debt cycle. Because the key turning points in the long-term debt cycle come along so infrequently (once in a lifetime), they are typically not well understood and take people by surprise. For a more complete explanation of the archetypical long-term debt cycle, see Part 1 of “Principles for Navigating Big Debt Crises” (link).
So, it appears to me that we are in the late stages of both the short-term and long-term debt cycles. In other words, a) we are in the late-cycle phase of the short-term debt cycle when profit and earnings growth are still strong and the tightening of credit is causing asset prices to decline, and b) we are in the late-cycle phase of the long-term debt cycle when asset prices and economies are sensitive to tightenings and when central banks don’t have much power to ease credit.

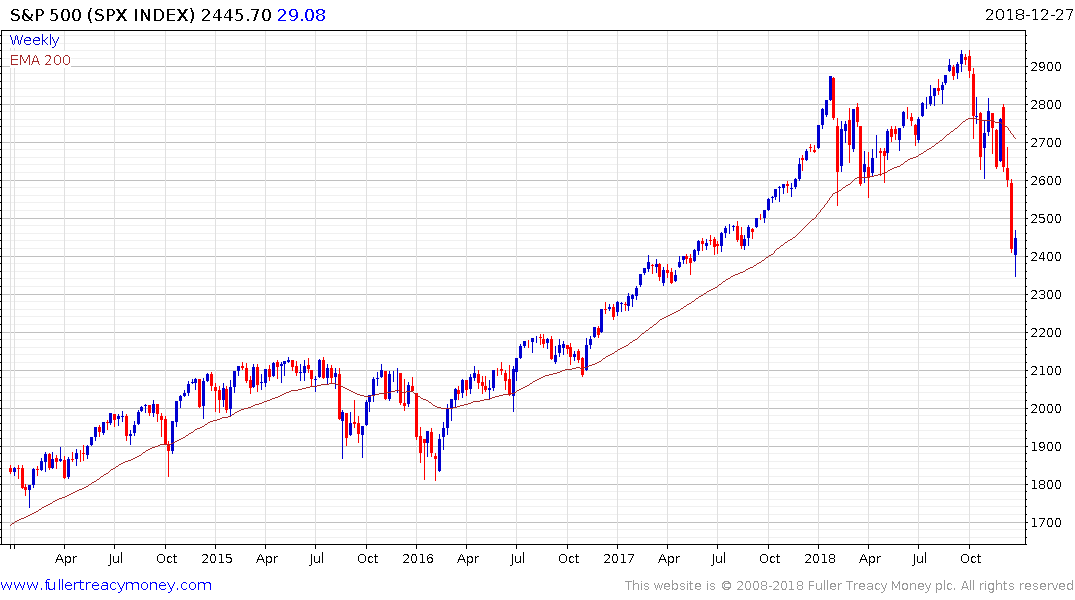
Both the Dow Jones Industrials and the S&P500 posted large upside key day reversals yesterday to signal lows of at least near-term significance. Neither followed through on the upside today but they did hold the moves. Considering just how much they fell since early this month there is certainly scope for a rebound but the true test of whether more than near-term support has been found will be in the extent to which they hold their lows.
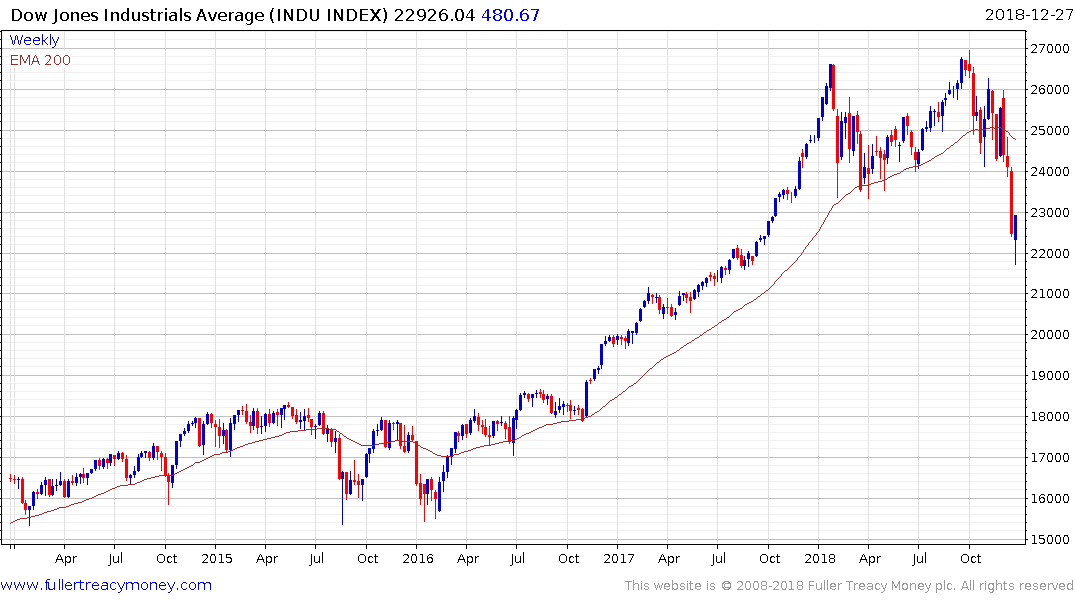
The much bigger picture is the Fed is simultaneously raising rates and reducing the size of its balance sheet. Predictably this has caused indigestion in the markets because it represents a significant loss of liquidity.
This graphic from Bloomberg highlights the fact that the peak of the run-off is occurring right now and that the pace will moderate from the 2nd quarter of next year. Nevertheless, it represents a significant drawdown from the global pool of available liquidity which is likely to be a drag on economic activity.
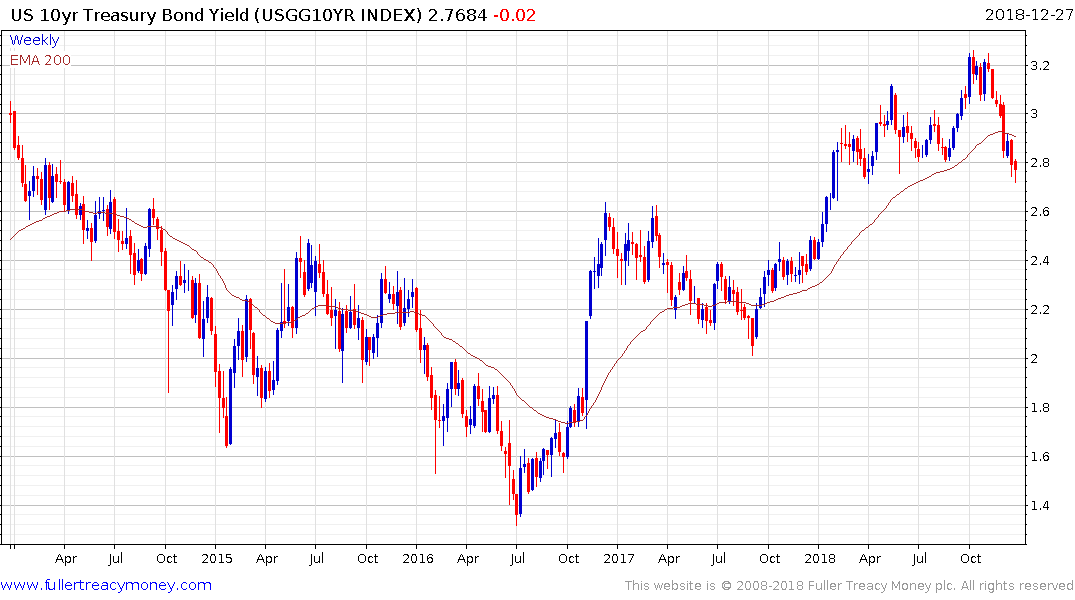
It has been our view at this service for a long-term that we are in the latter stages of the long-term debt cycle. However, right now the volatility on stock markets is creating demand for the relative safe haven of Treasuries. The 10-year yield declined today to countermand yesterday’s bounce suggesting continued demand dominance.
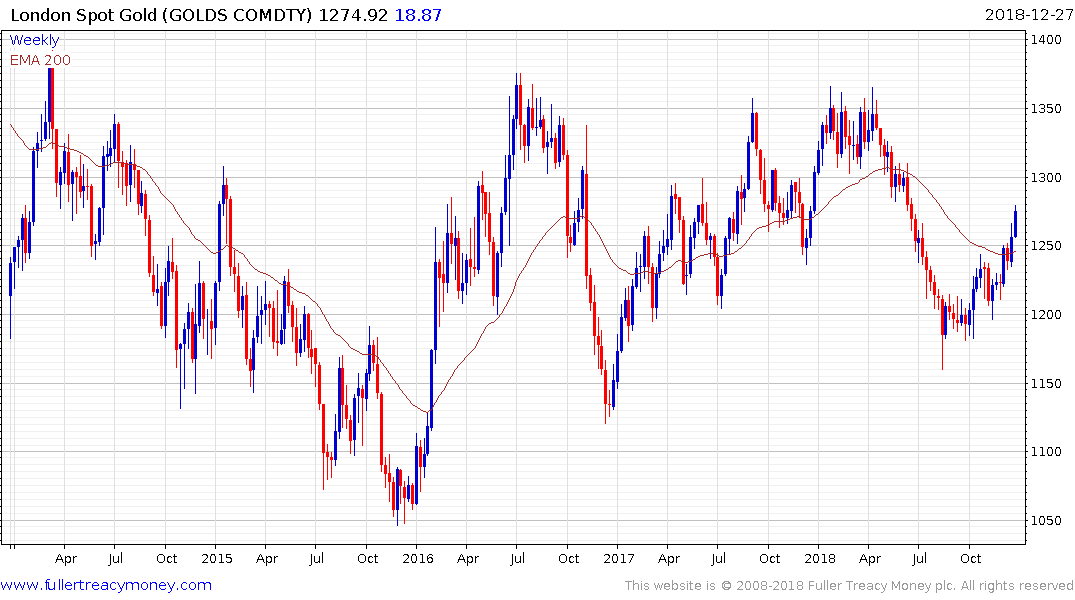
Gold continues to extend its rally above the trend mean and a sustained move below $1250 would be required to question potential for additional upside.