
The Periodic Table of Commodity Returns

Eoin Treacy's view I had not previously seen this type of illustration of commodity performance
but it does help to depict the volatility of some sectors relative to others,
over the last decade. For example, gold has posted a positive return every year
since 2001. Silver, platinum and palladium have posted similar positive returns,
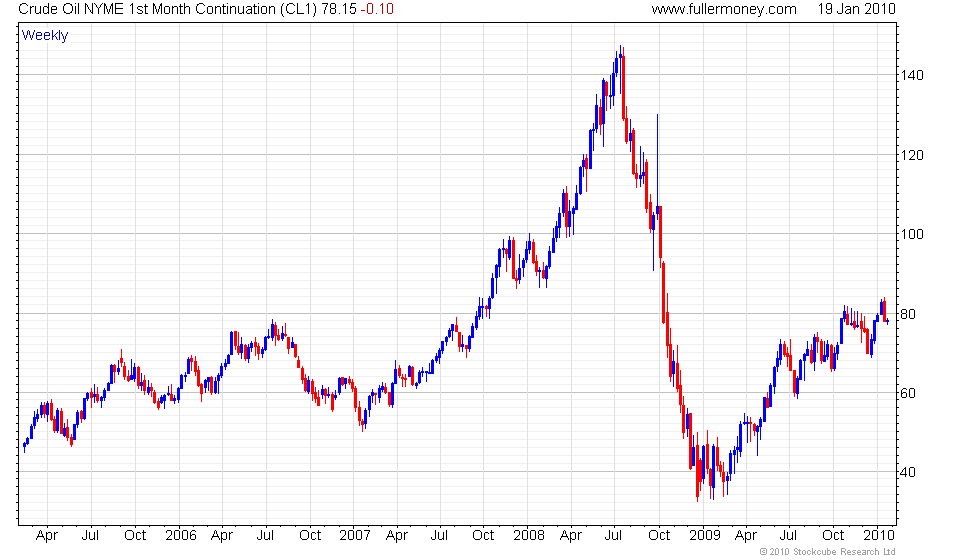
with the exception of 2008. The energy complex has been much more volatile.
Oil posted a positive or flat return every year from 2002, bar 2008. Natural
Gas and Coal have been much more prone to big fluctuations in price.
Oil
was one of the better performers last year but coal and natural gas both had
negative returns in 2008 and 2009, they theoretically have potential to participate
in a catch-up move this year.
Coal
has sustained a progression of incrementally higher reaction lows since bottoming
in May 2009. Prices spiked higher in the first week of January and have been
consolidating that move since. A sustained move above $60 would complete the
base and indicate a return to more pronounced demand dominance.
Crude
oil topped out relative to natural
gas in August 2009 and continues to underperform. Natural gas prices bottomed
in September near $2.50 and while the continuation chart has been flattered
by the contango, prices have since rallied to test the psychological $6 level.
A sustained move below $4 would now be required to question scope for further
higher to lateral ranging.